We recommend regular monitoring of fraud metrics to detect fraudulent schemes and find the source of bad traffic.
You can download a graph using the button, customize data display type and hours/days/weeks/months detailing. To analyze fraud in details, click to go to the Builder.
A brief description of Fraud Scanner reports is given below.
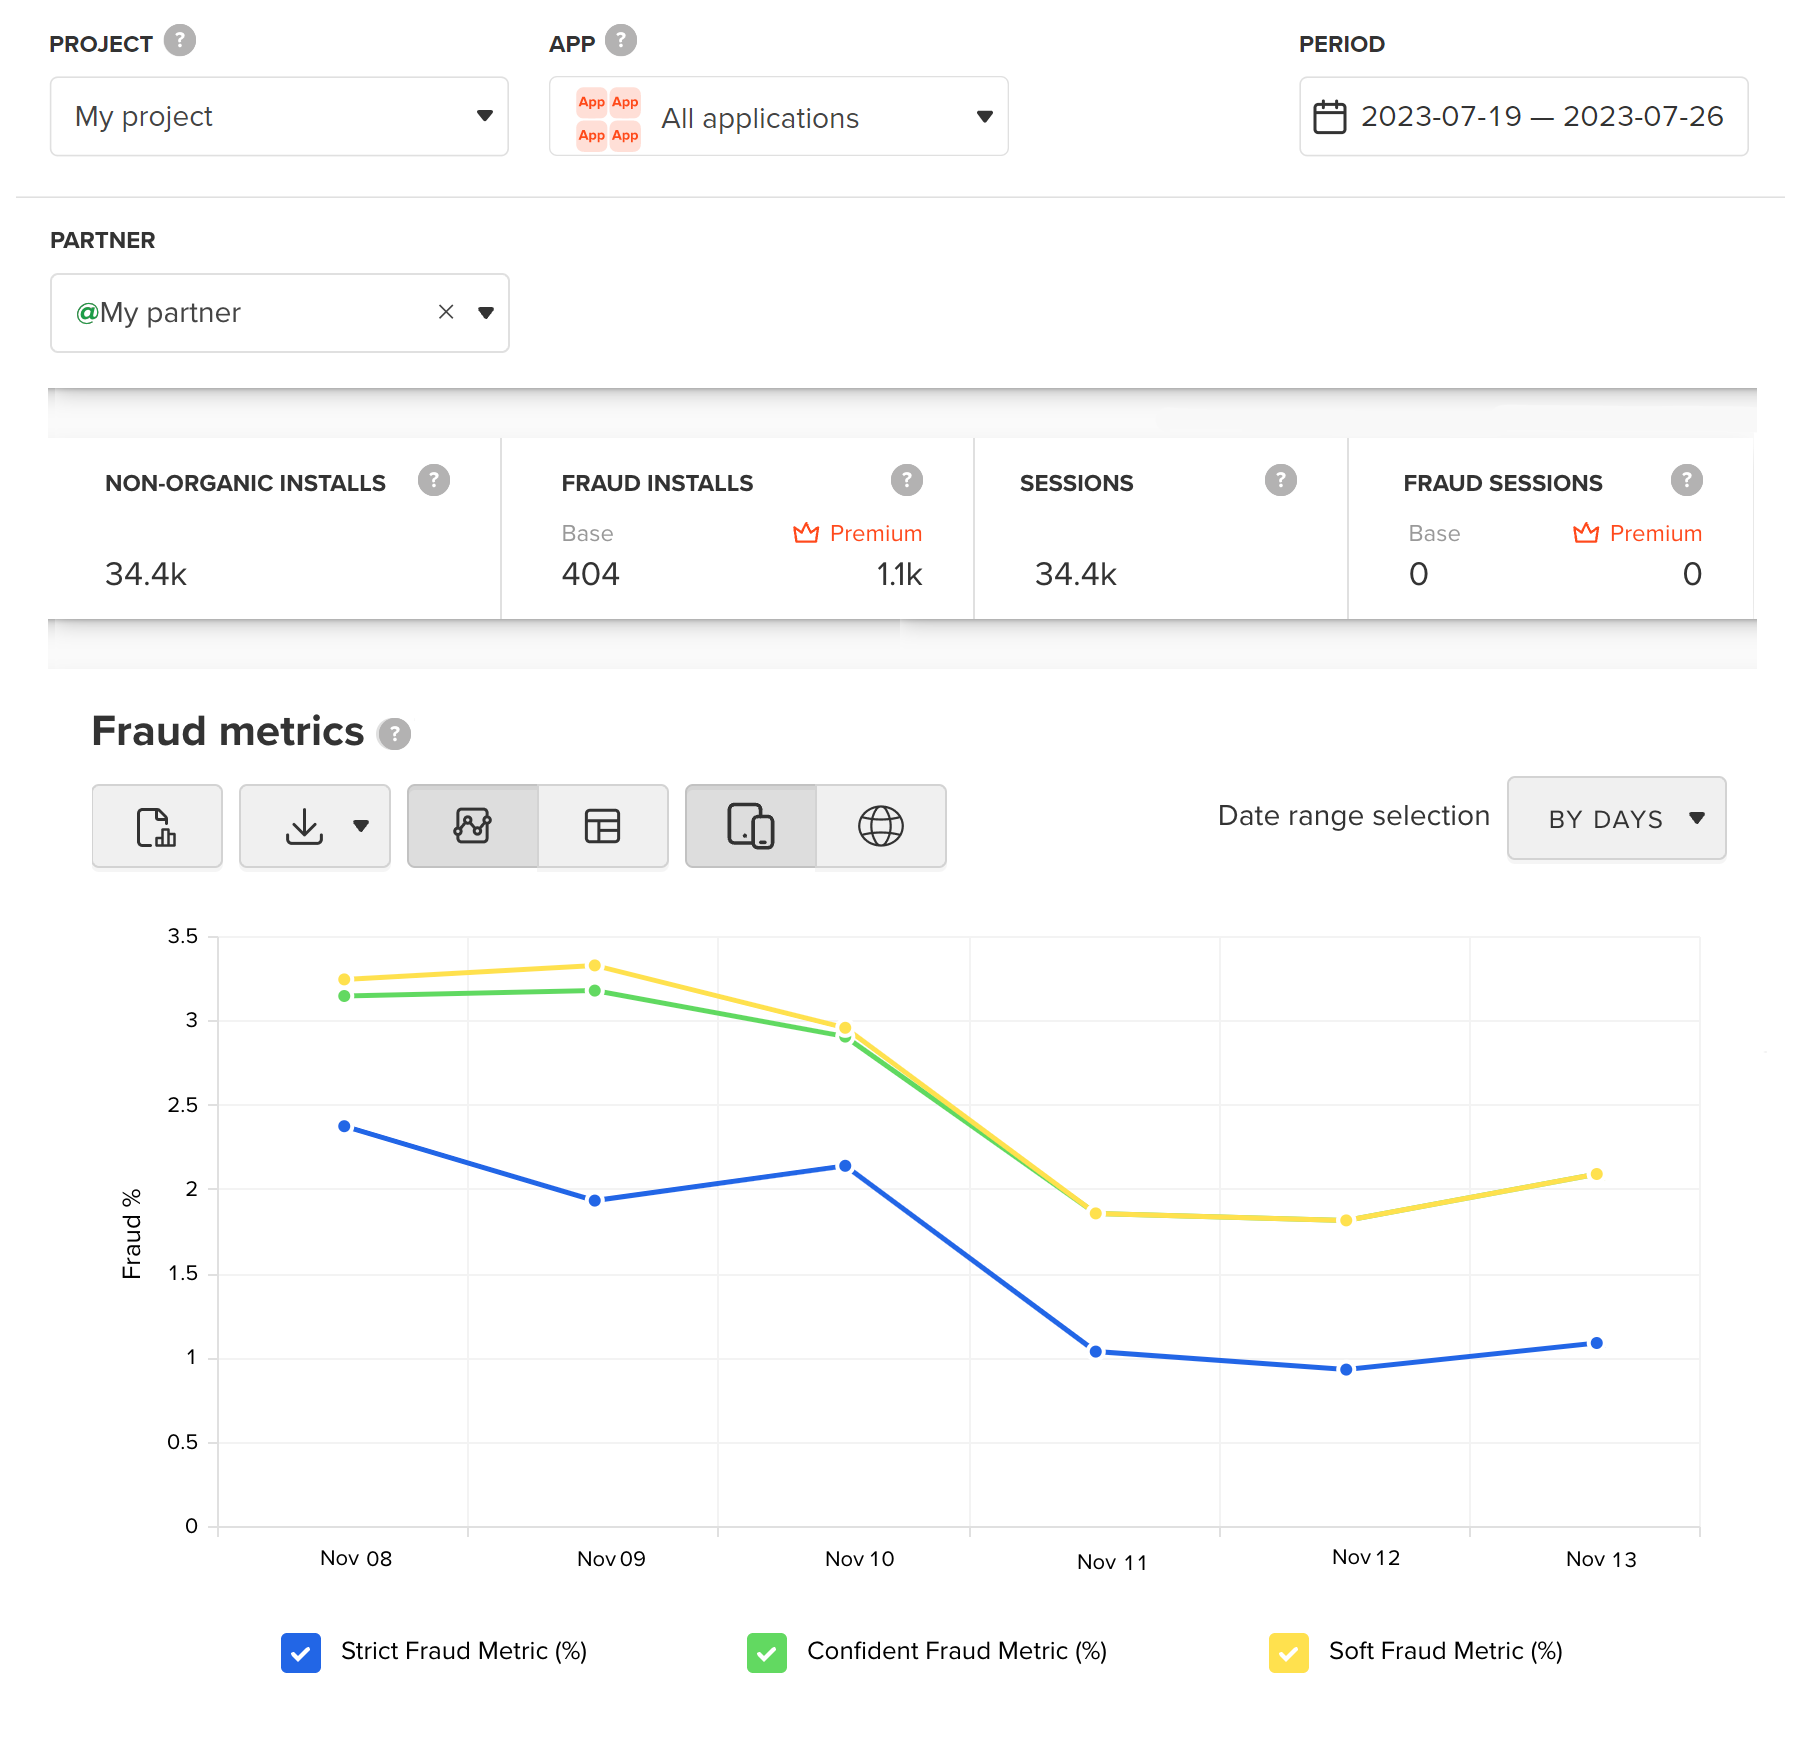
The graph shows a share of fraud in mobile and web traffic.
The graph shows details on combined fraud metrics on mobile and web traffic.
The graph displays fraud types on mobile traffic: hardware fraud, click fraud, and in-app fraud.
The graph displays fraud installs and web sessions grouped by a partner.
The graph displays the share of clean and fraud traffic grouped by a partner.
The graph displays the time from impression/click on an ad to install. Too quick or too long installs may indicate fraud.
For information on building and analyzing reports, see the Fraud analysis in the Builder section