To analyze a built path, click on its name in the user paths list. The path calculation result in MyTracker is presented as a diagram with elements like a step, a node, and a path.
Path TO shows all completed events or visited pages that precede the selected node. Click once on the node, and a path section will be added to the diagram. Click the node again, and the added step will disappear.
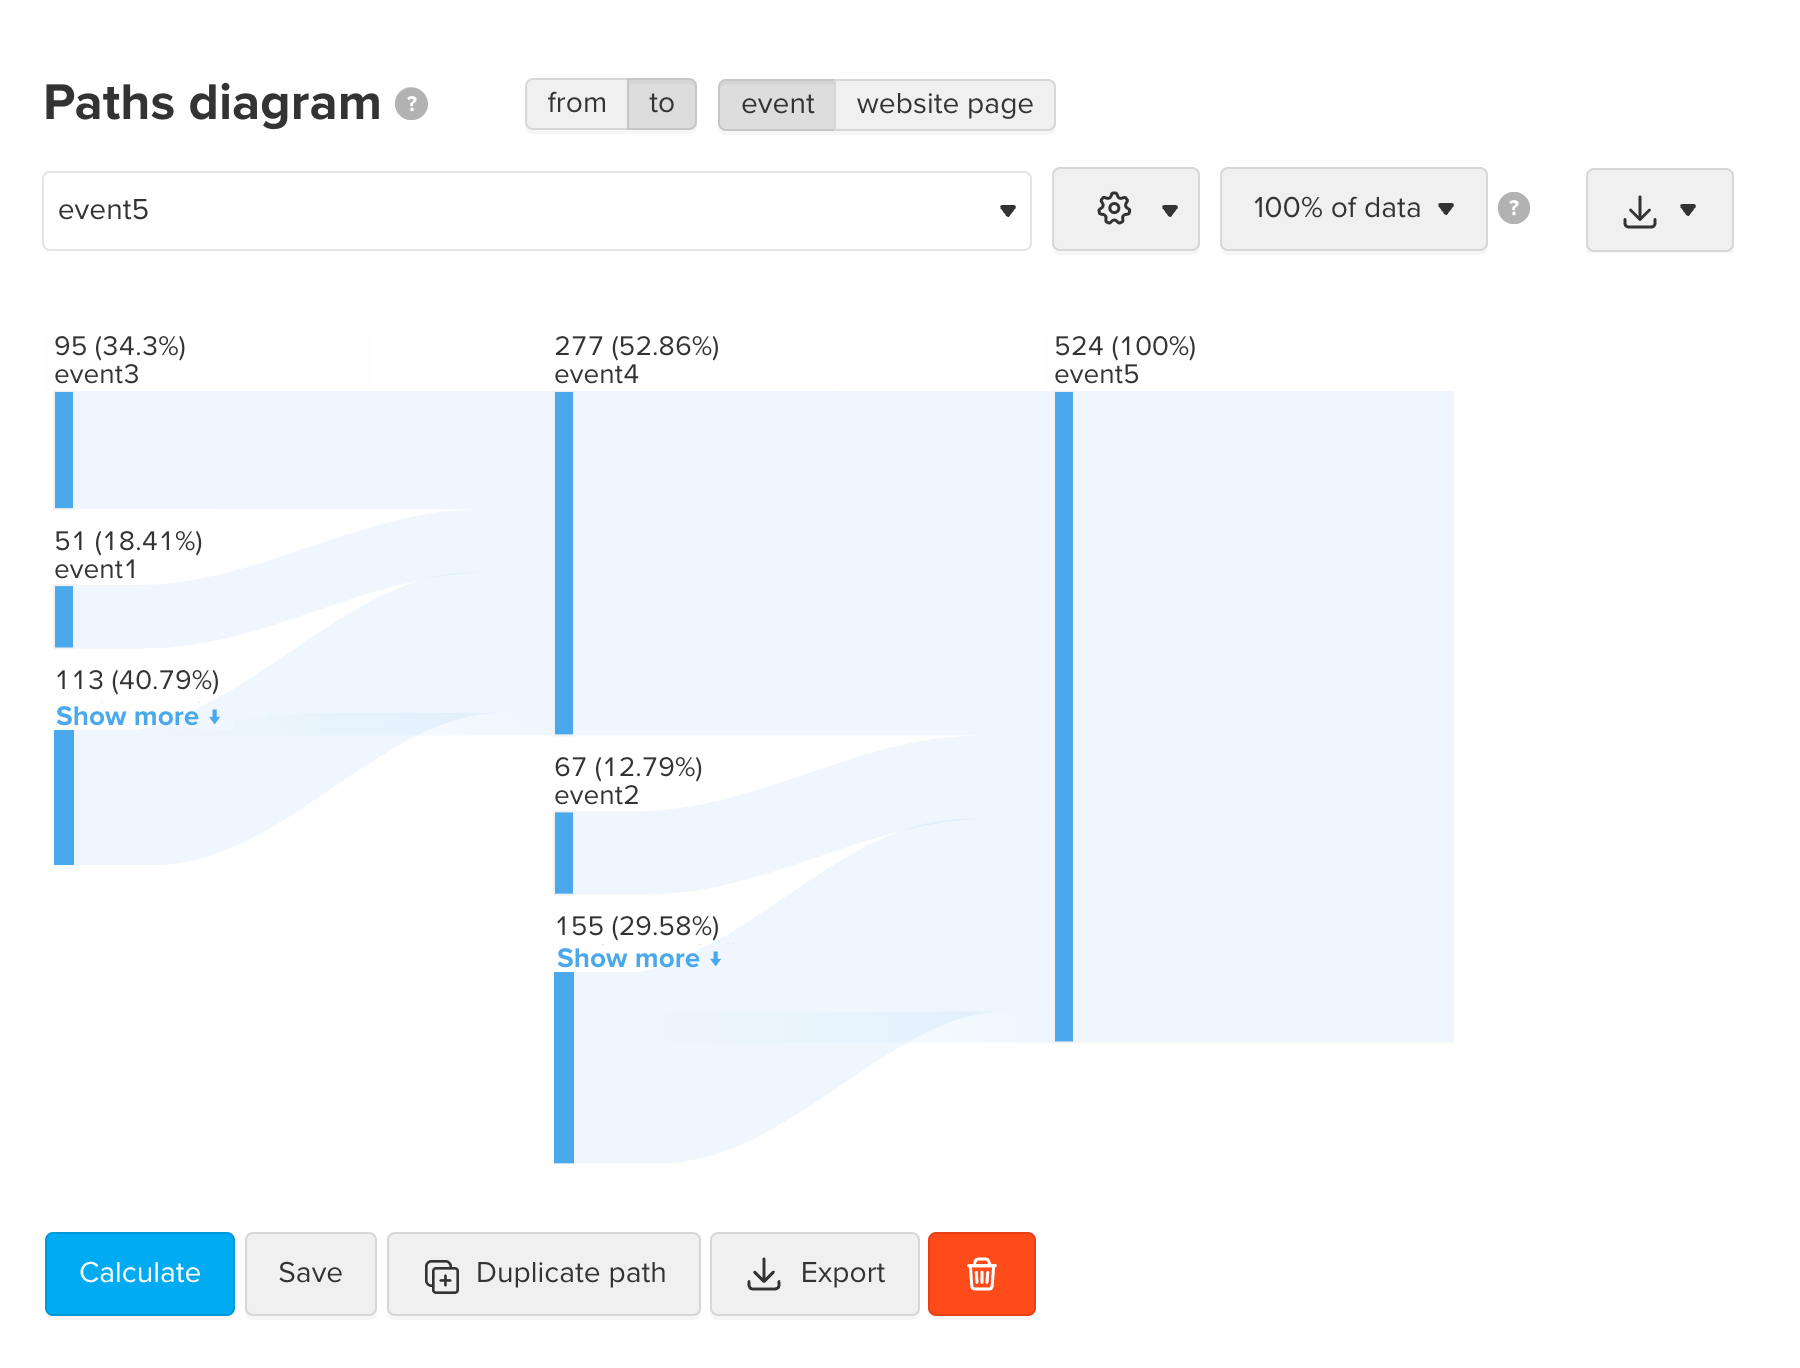
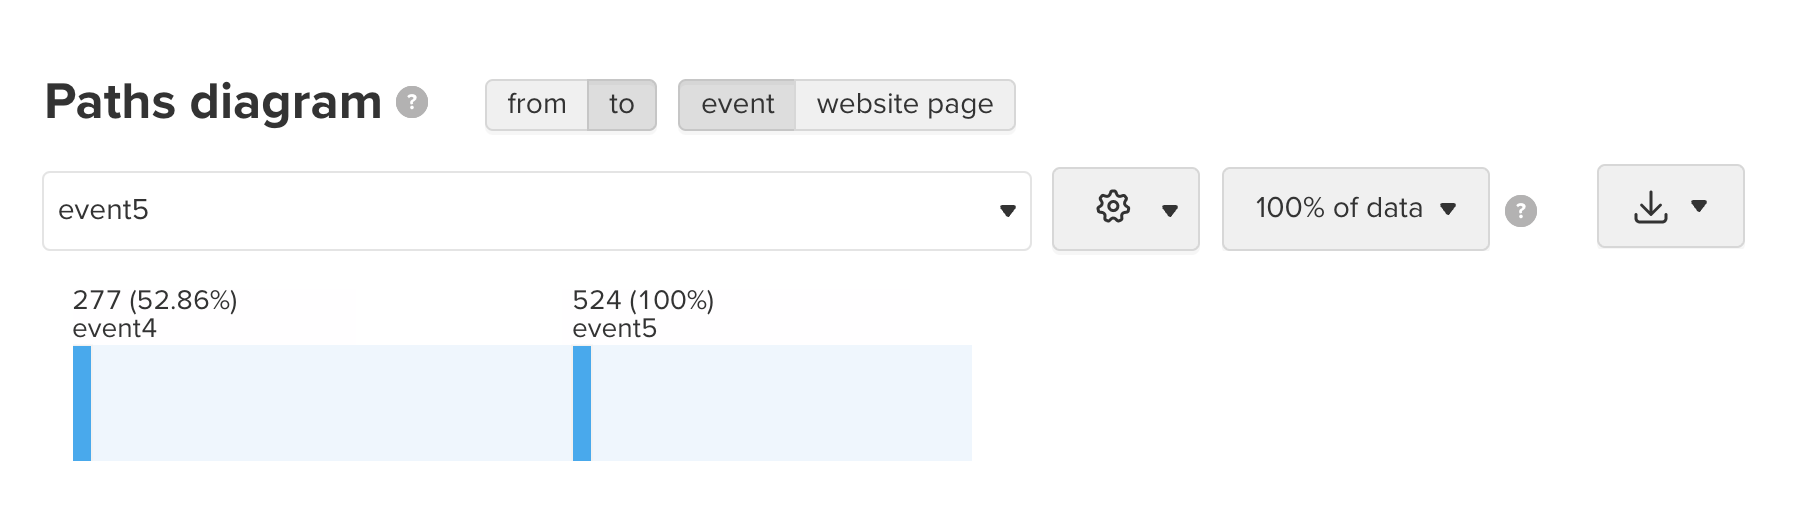
For example, the picture below shows the path to the event5: 95 users went through event3, and 277 users went through event4 to perform event5.
Path FROM shows all events or visited pages that occur after the selected node.
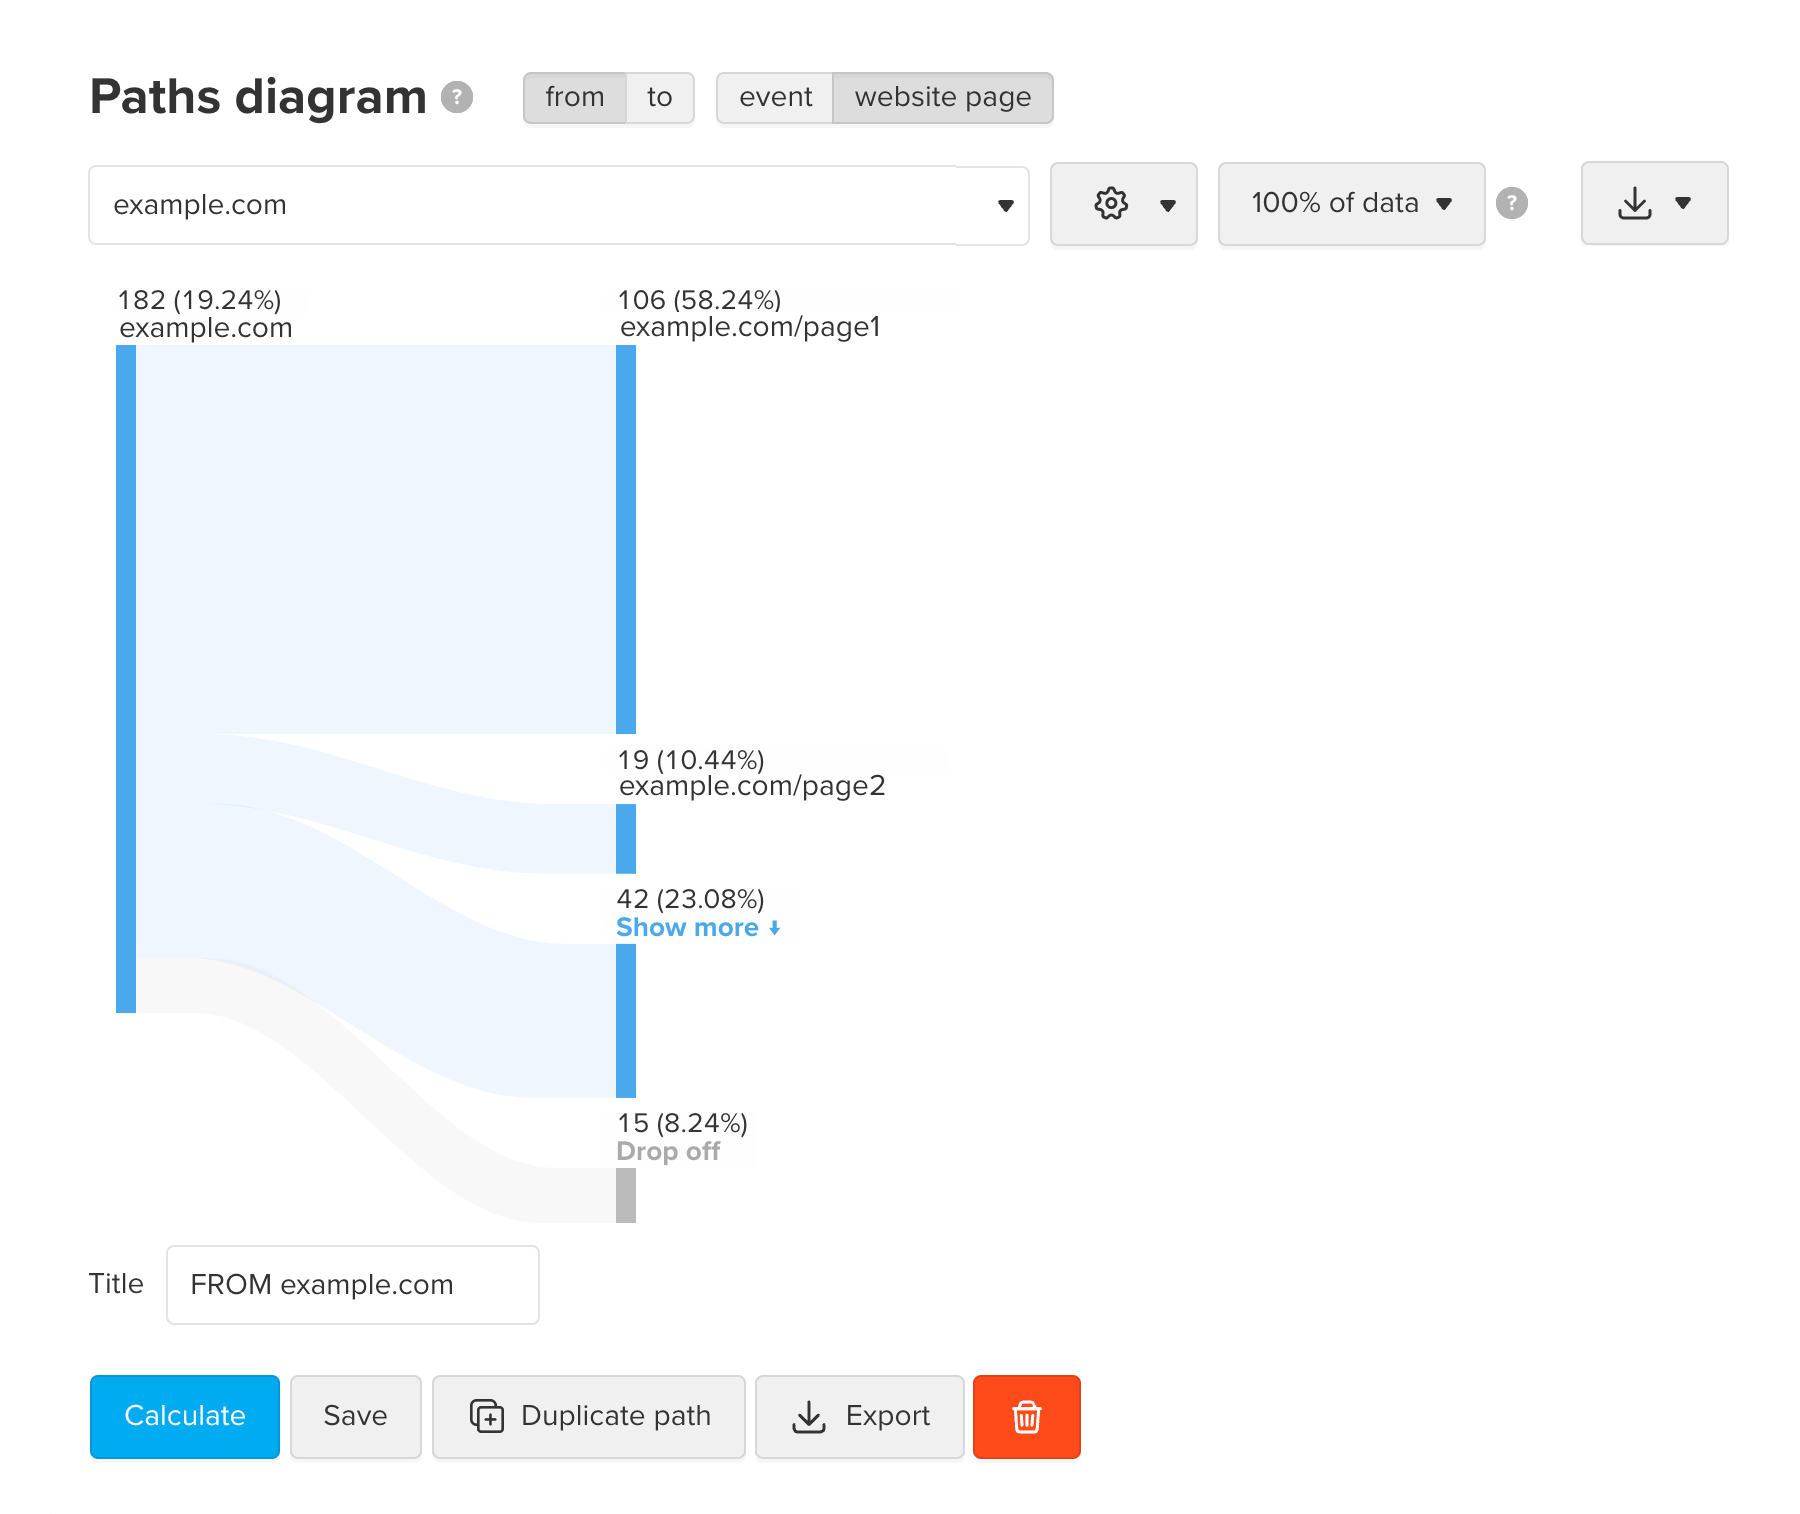
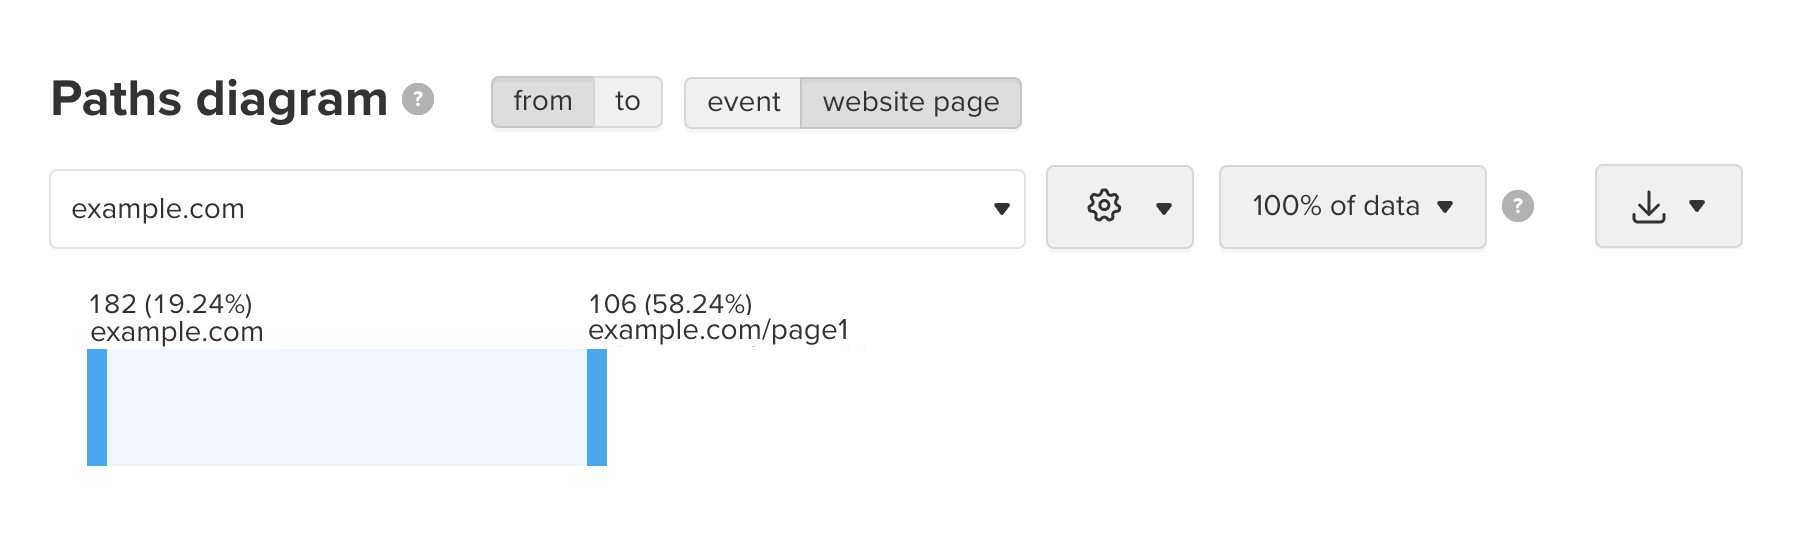
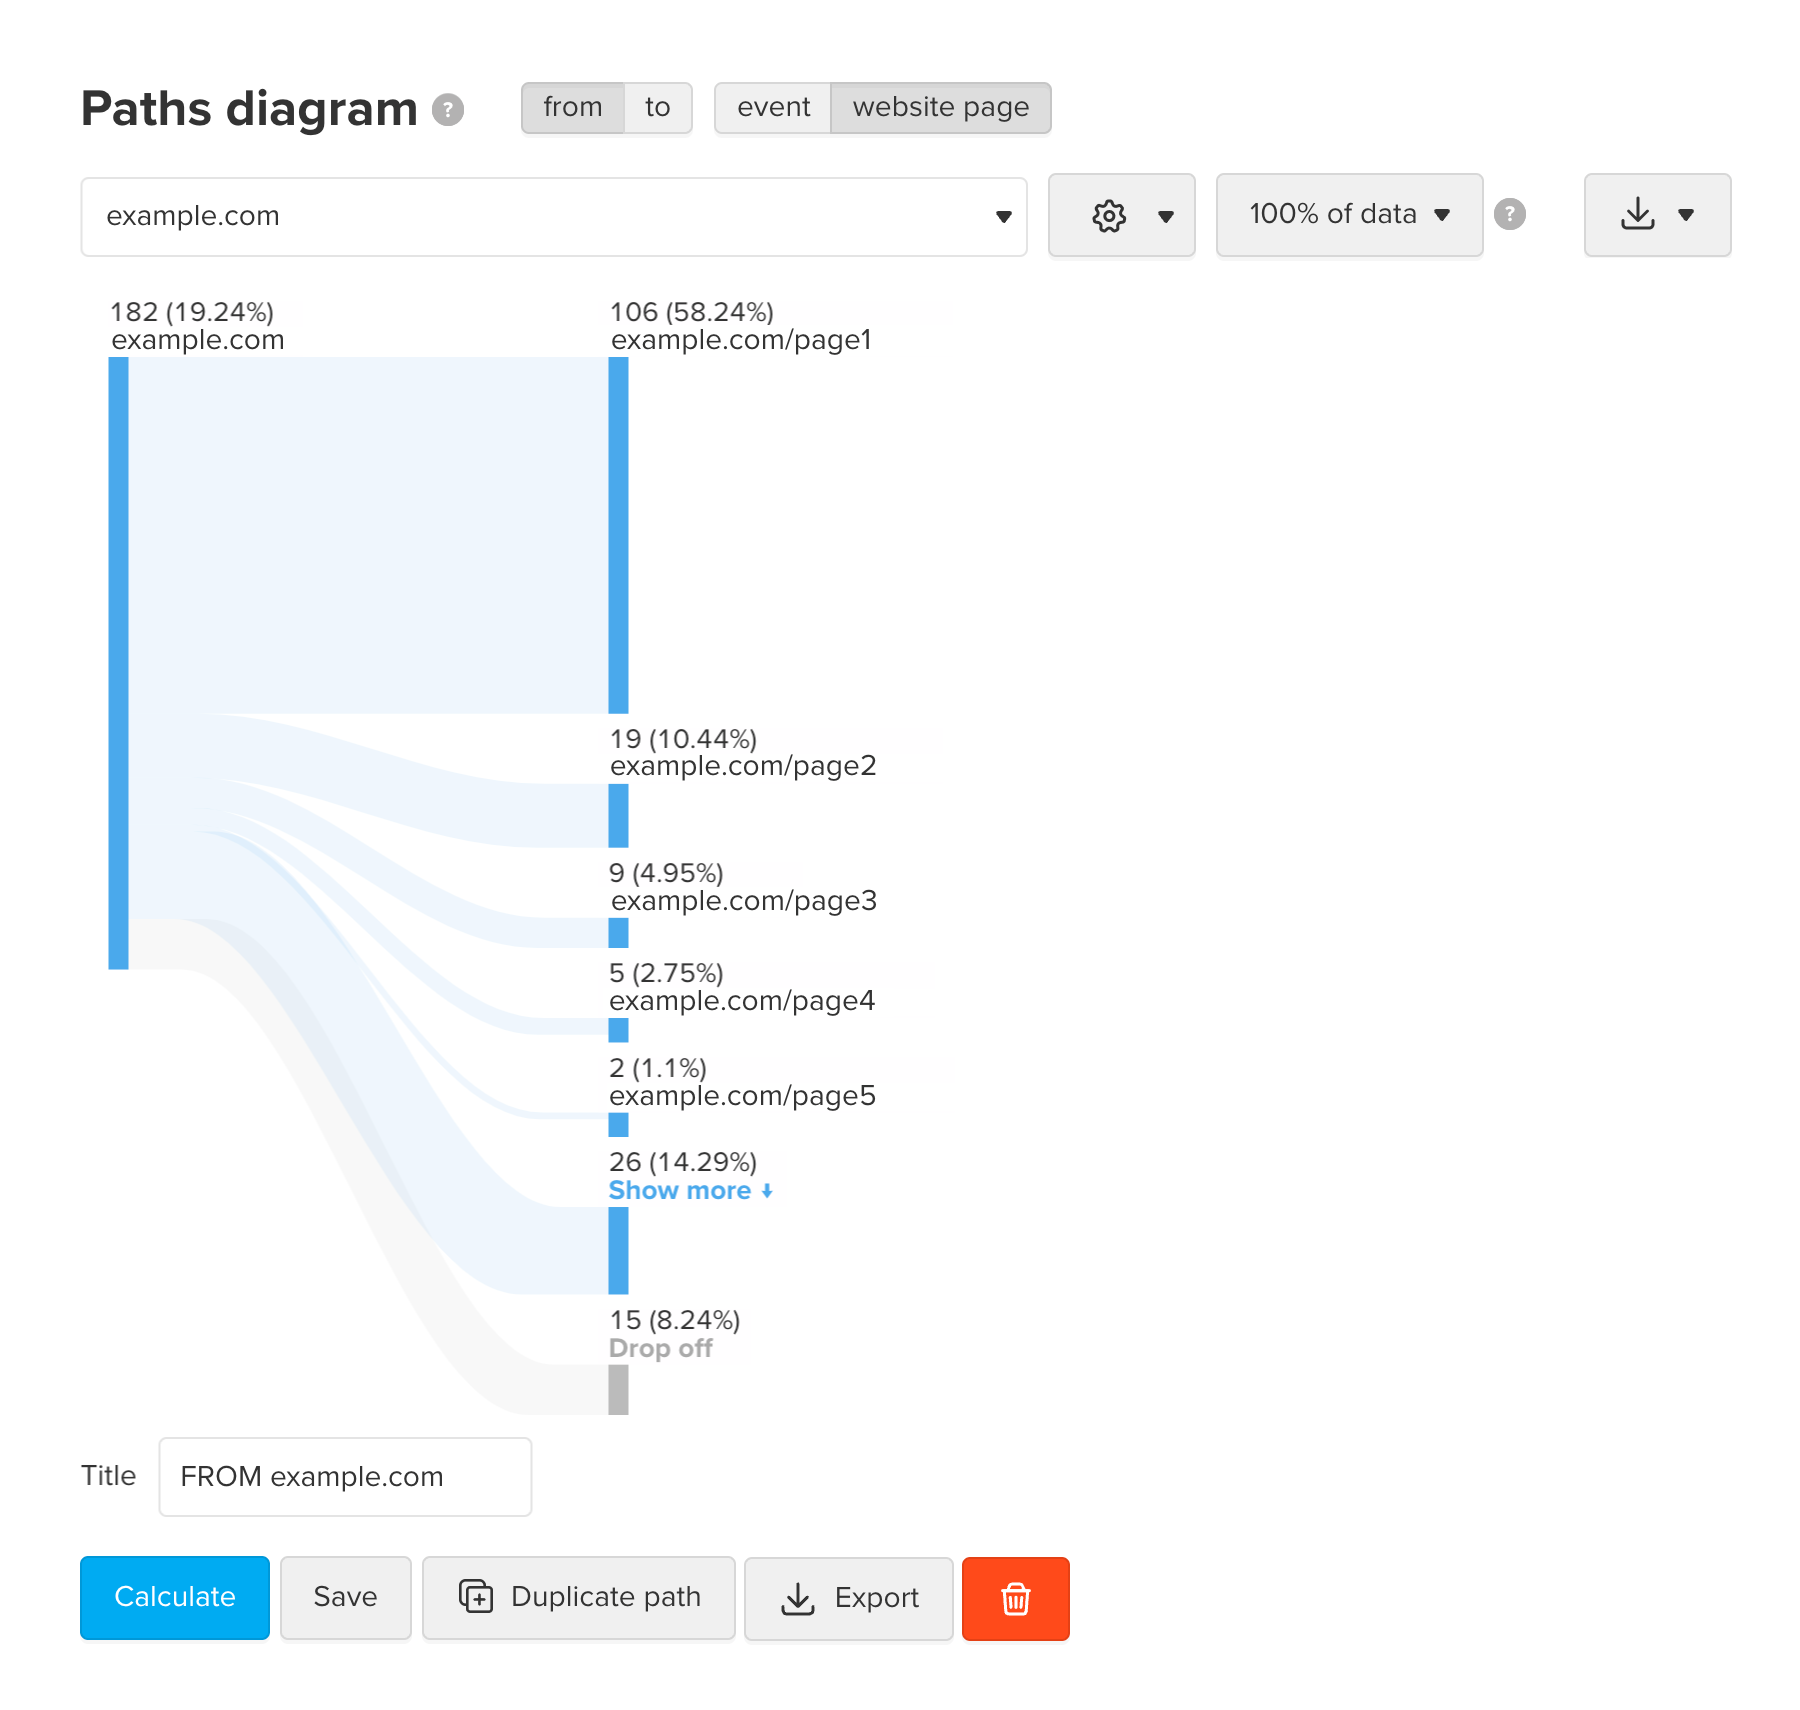
For example, in the picture below, the path from the example.com page shows that the most popular path leads to page1. It was chosen by 106 users out of 182. The second most popular path leads to page2.
Each diagram node displays the name of the event or page URL, the number of users, and their share relative to the previous or next node.
When calculating the diagram from the page example.com based on the specified filters and in the selected period, MyTracker shows that 106 users (58.24% of the previous node audience) moved to the page example.com/page1.
When calculating the diagram to the event, MyTracker shows that 277 users moved to event5 after event4. The share of the audience that completed event4 relative to event5 was 52.86%.
The Show more node is displayed on the diagram automatically, and it can contain up to 34 other nodes inside. Click on the Show more node, and three new nodes will open on the same step.
For example, the picture below shows that after clicking on the Show more node, nodes page3, page4, and page5 opened.
The 35th and following nodes are grouped into Other nodes, as shown in the picture below. This node displays the number of other nodes and users on them, and the node cannot be expanded.

The Drop off node shows how many users left at the previous step and their share in it. For example, in the picture above, 15 users (8.24% of the previous node audience) left the project. The Drop off node cannot be expanded.
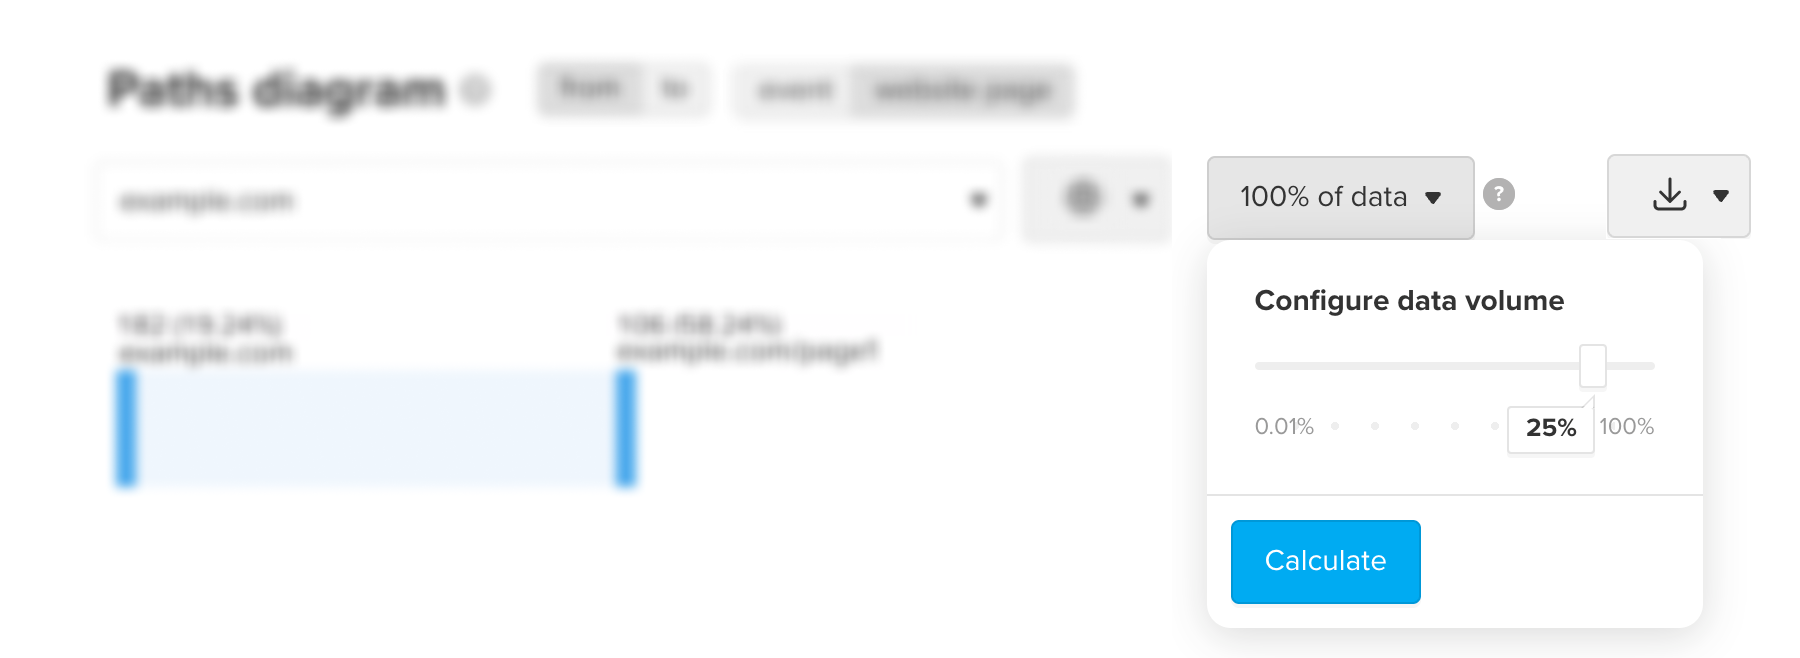
The processed data percentage will be reduced to the maximum allowed automatically for large diagrams. It’s a sampling mechanism that speeds up calculations.
You can change the sampling percentage yourself: reduce it to speed up the calculation or increase it for greater accuracy. The analysis of the sample will give a general idea of the total data volume. Remember that too low a percentage speeds up the calculation, while the results accuracy decreases.