Insights is information about the interests and social status of your users. With insights you can build an effective marketing strategy, increase the appeal and value of the product.
MyTracker insights will help to:
For insights, MyTracker collects aggregated and randomized data from social services accounts, search requests, and other data of VK users.
MyTracker is committed to the privacy and security of users' personal information. Insights cannot be used to identify a specific device or user.
Use insights as a marketing tool. For example, to find out whether users watch TV and whether to run TV ads, analyze interest categories and add popular content to your product.
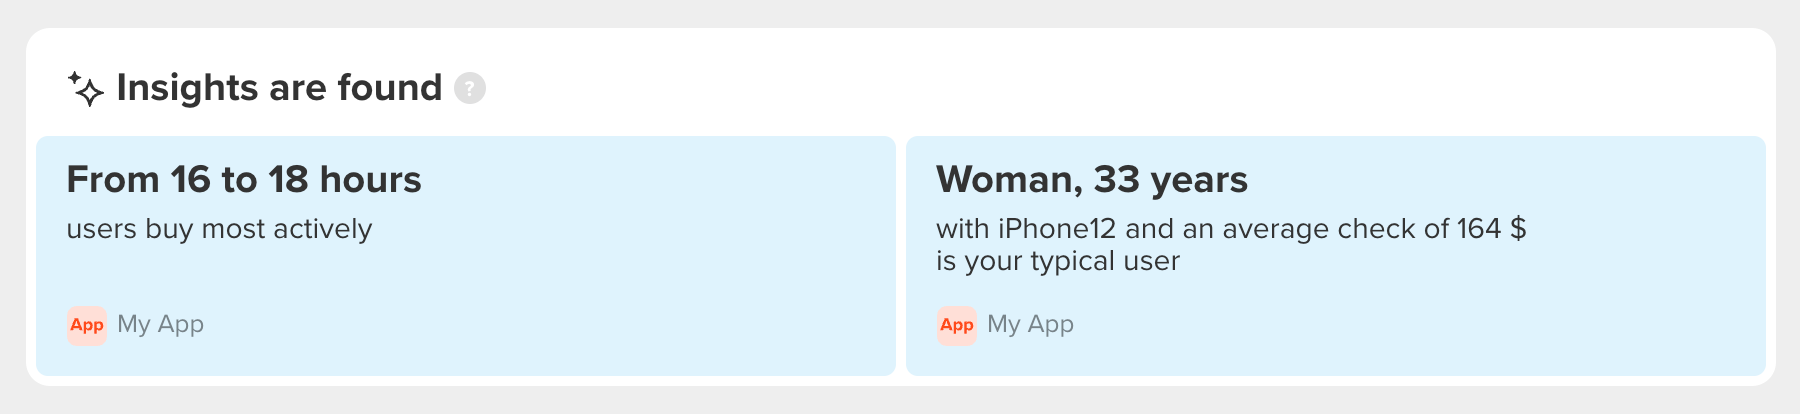
Found insights are notifications that show unique features of your traffic and users behavior. They are selected individually for each project, website, or application and are updated daily.
You can use found insights to get to know your audience better, for example:
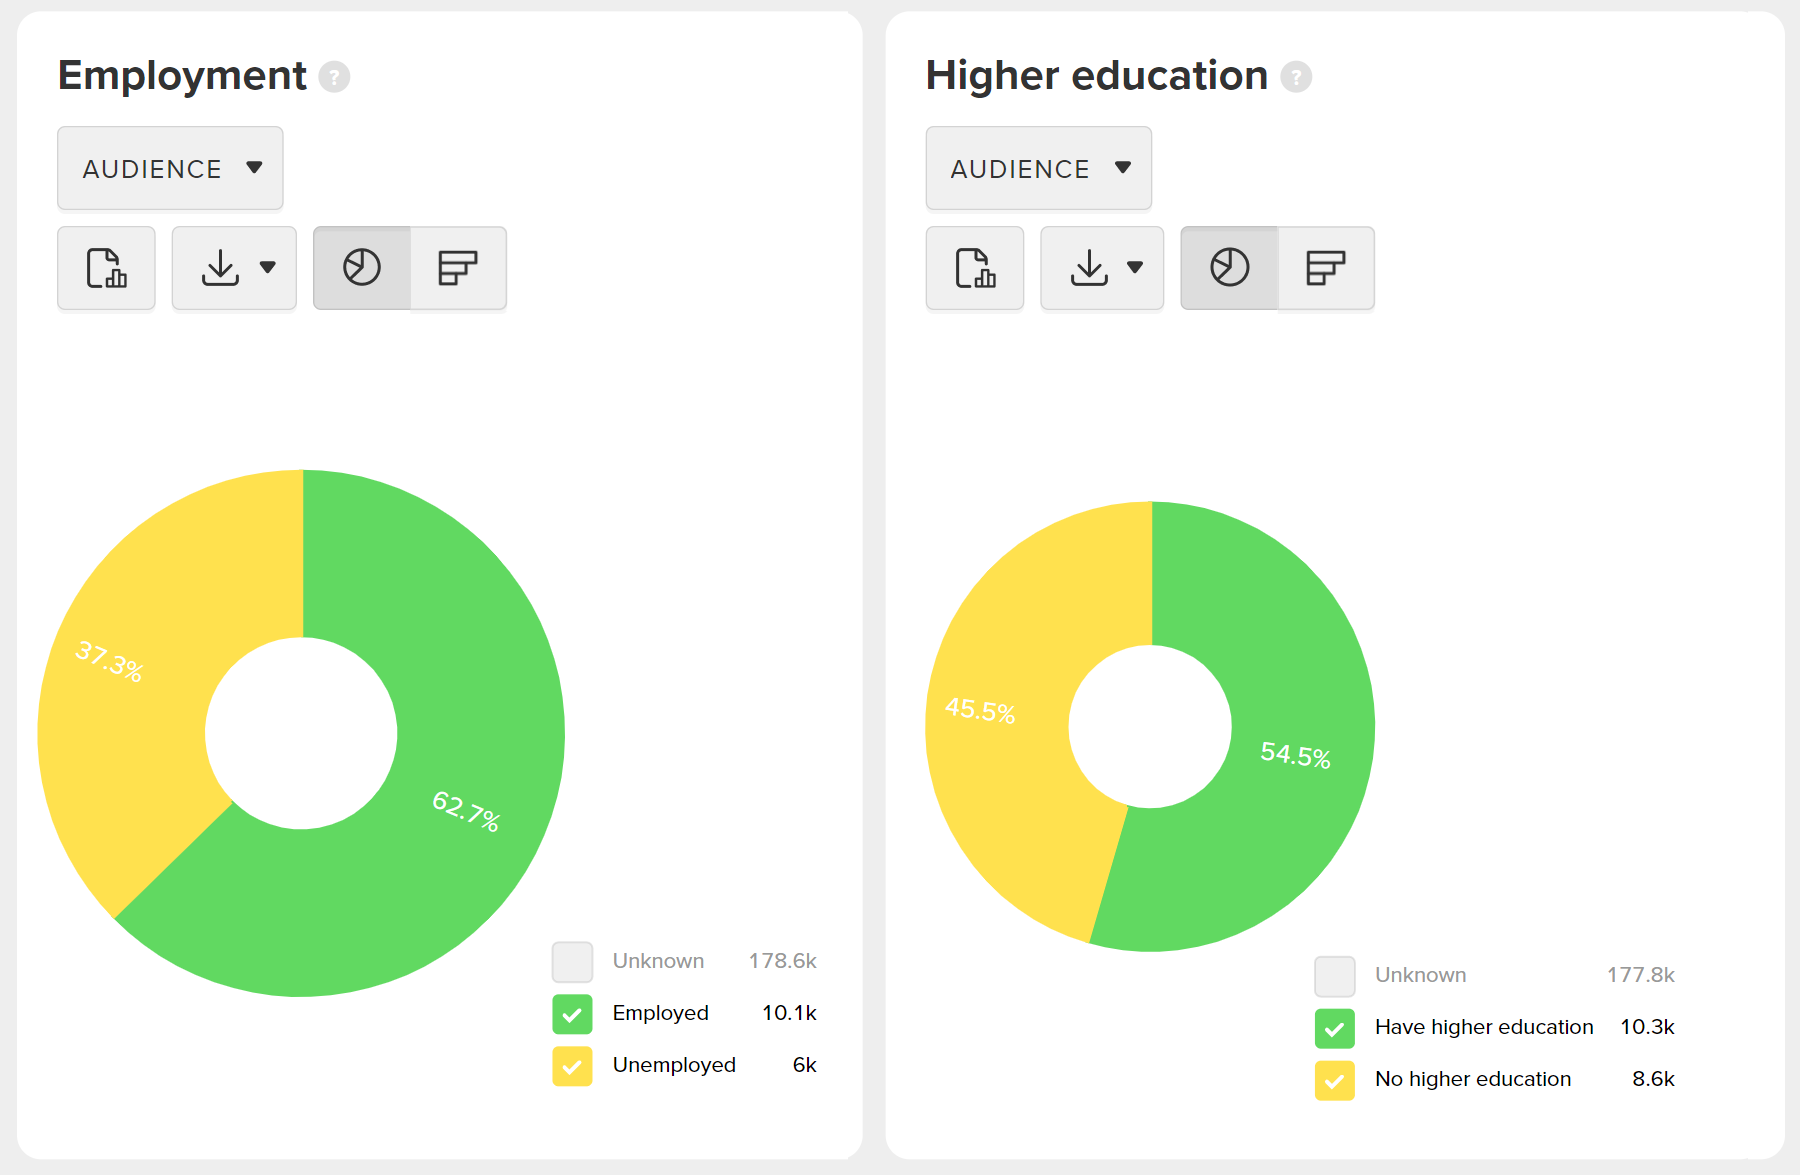
To analyze social and demographic data, use diagrams in reports Insights and dimensions in Builder:
In reports Insights, you will find charts for categories Employment and Higher education. The diagrams show the share of your users with a higher education, how many users are employed, and the share of unemployed users.
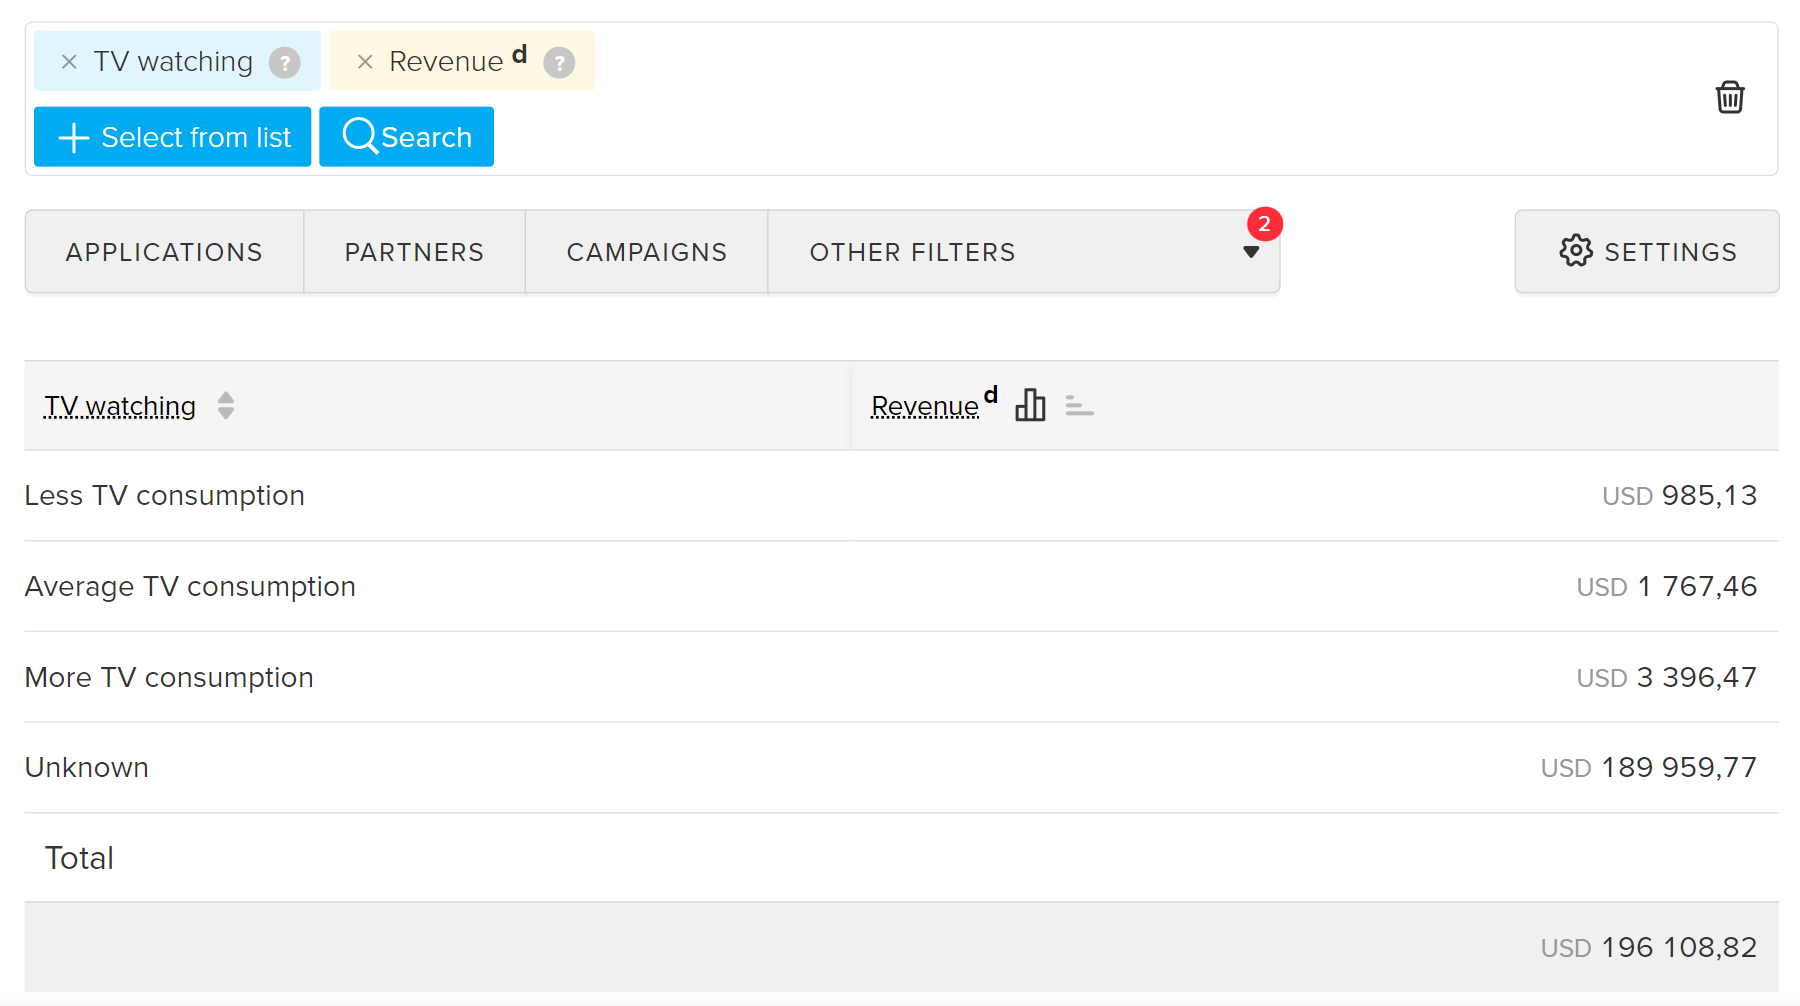
To get a detailed report, go to Builder and use dimensions Geo & Demography. For example, check how often the users who bring in the most revenue are watching TV.
To explore user interests, use the Insights report.
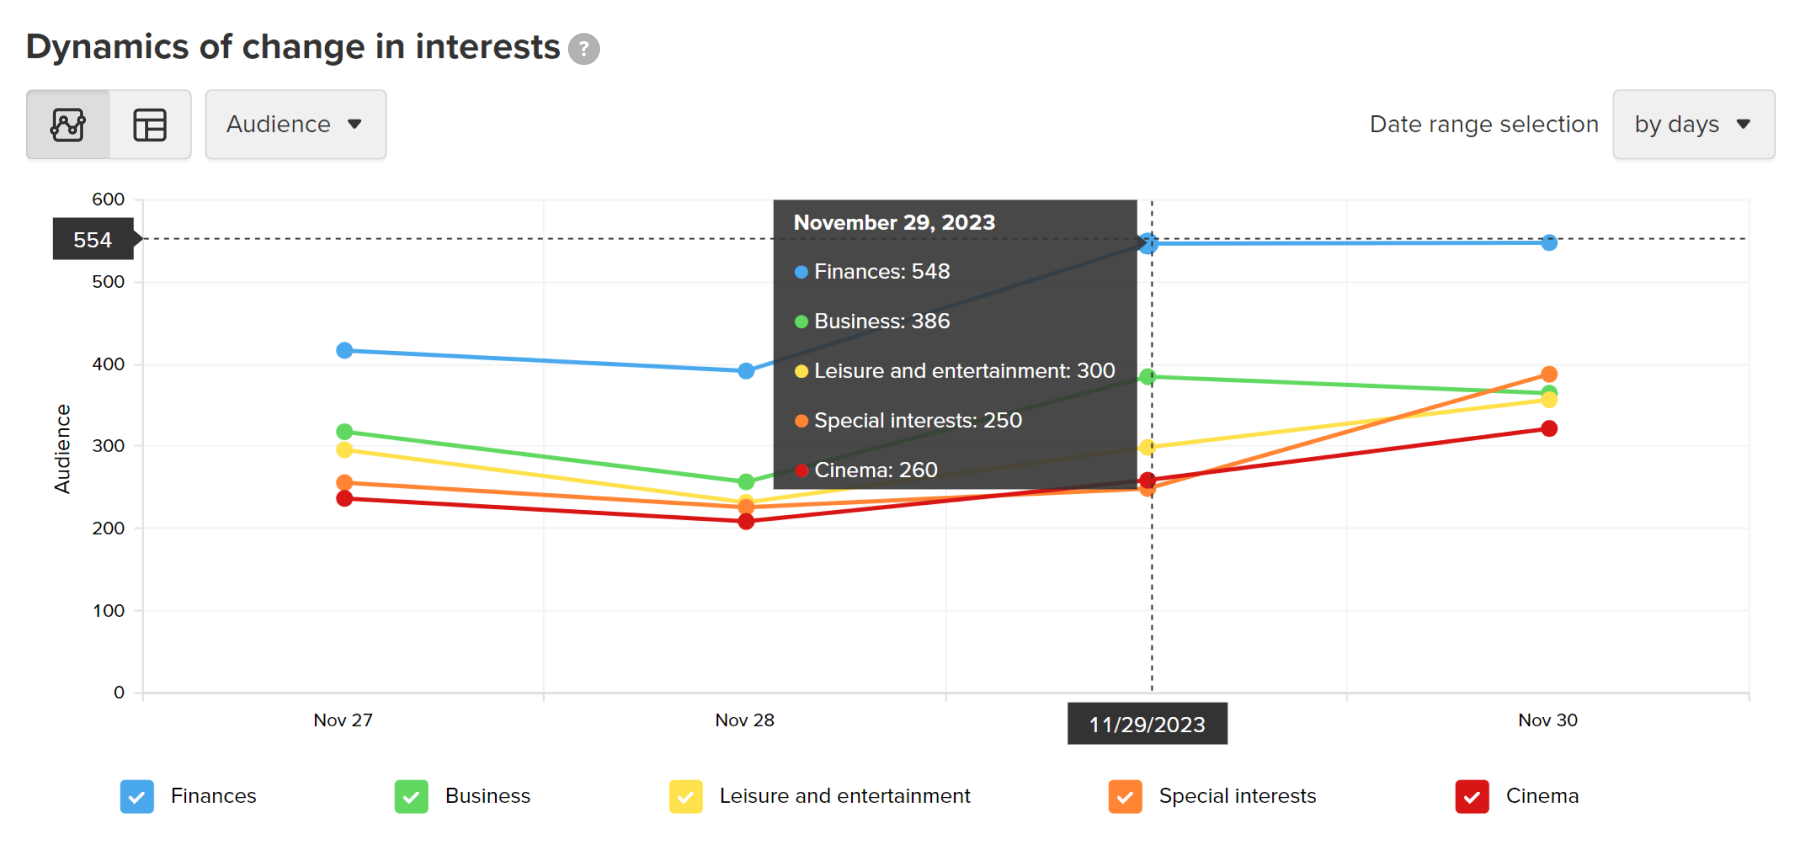
Dynamics of change in interests
Use the Insights → Dynamics of change in interests report to analyze how the interests of your audiences are changing. The diagram displays the 5 most popular categories for each day/week/month.
Use the drop-down list to change the data sample:
Explore the interests of your users via the Insights → Audience Interests report. The table displays how many users are interested in a particular category and theme. For example, the Finance category and the Banking services interest.
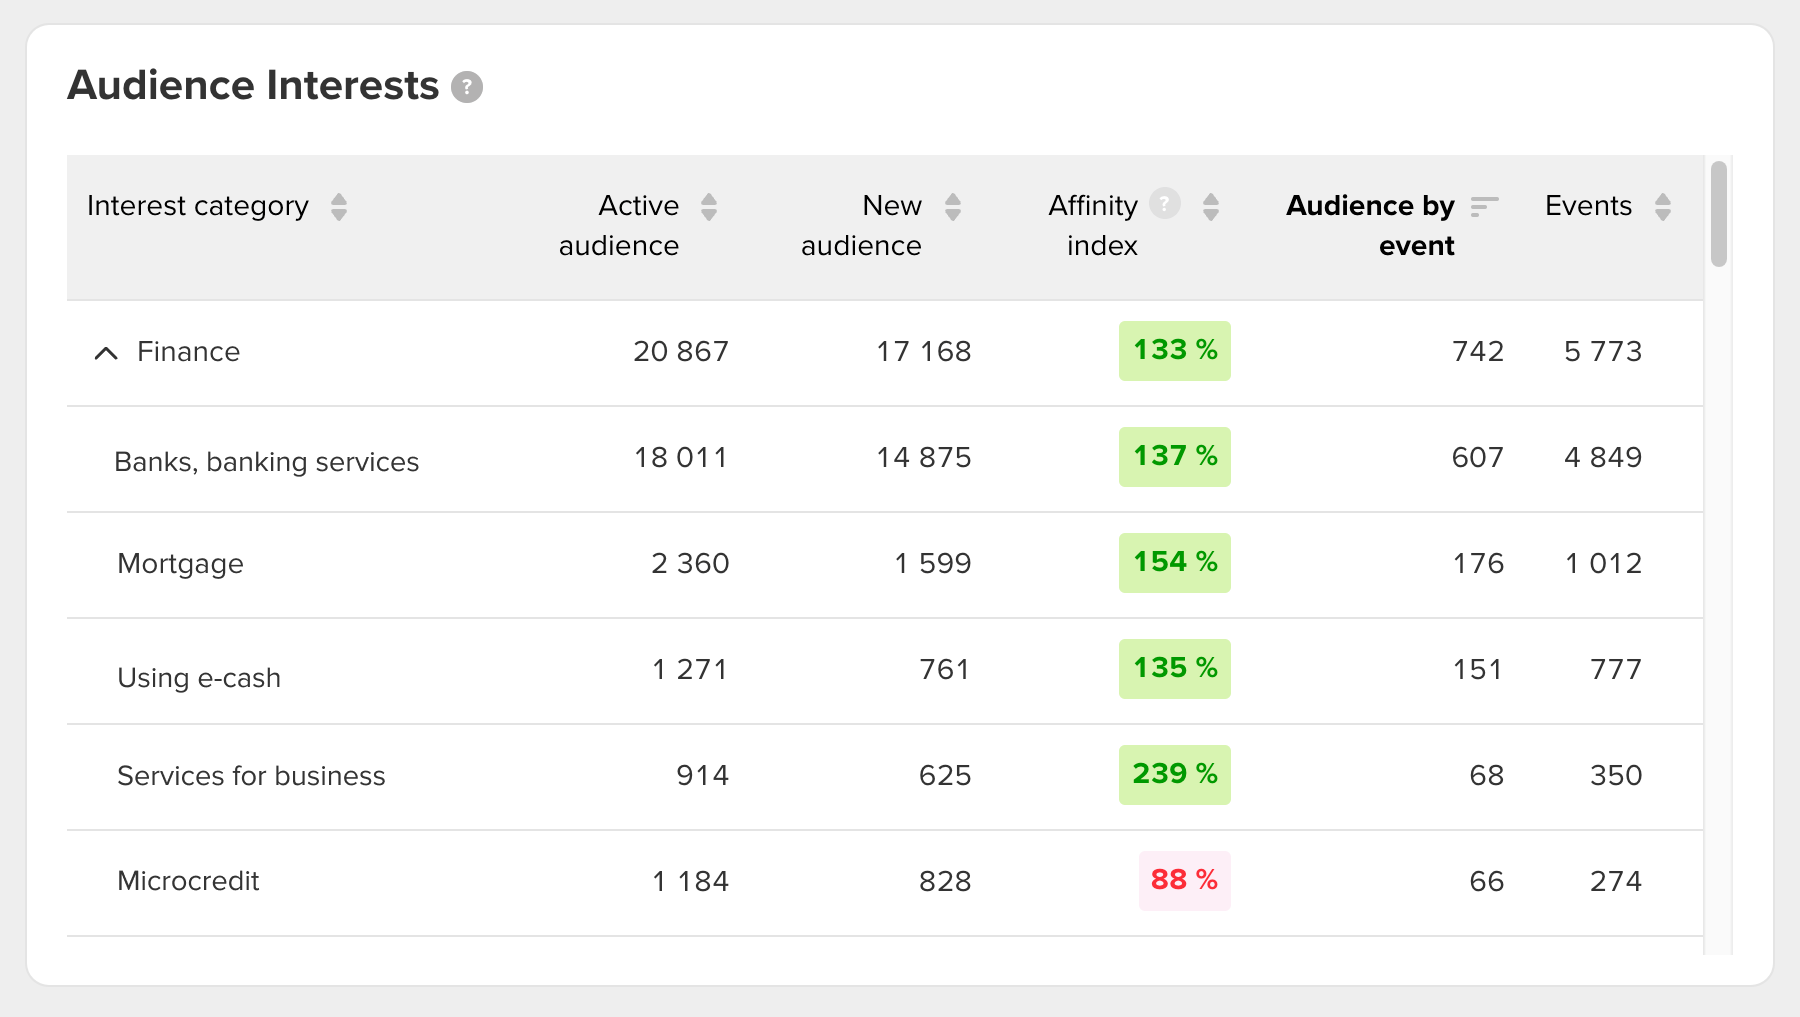
The report includes the data on your audiences:
The sum of all categories can exceed the number of the active and new audience in your project, because the user may have several interests.
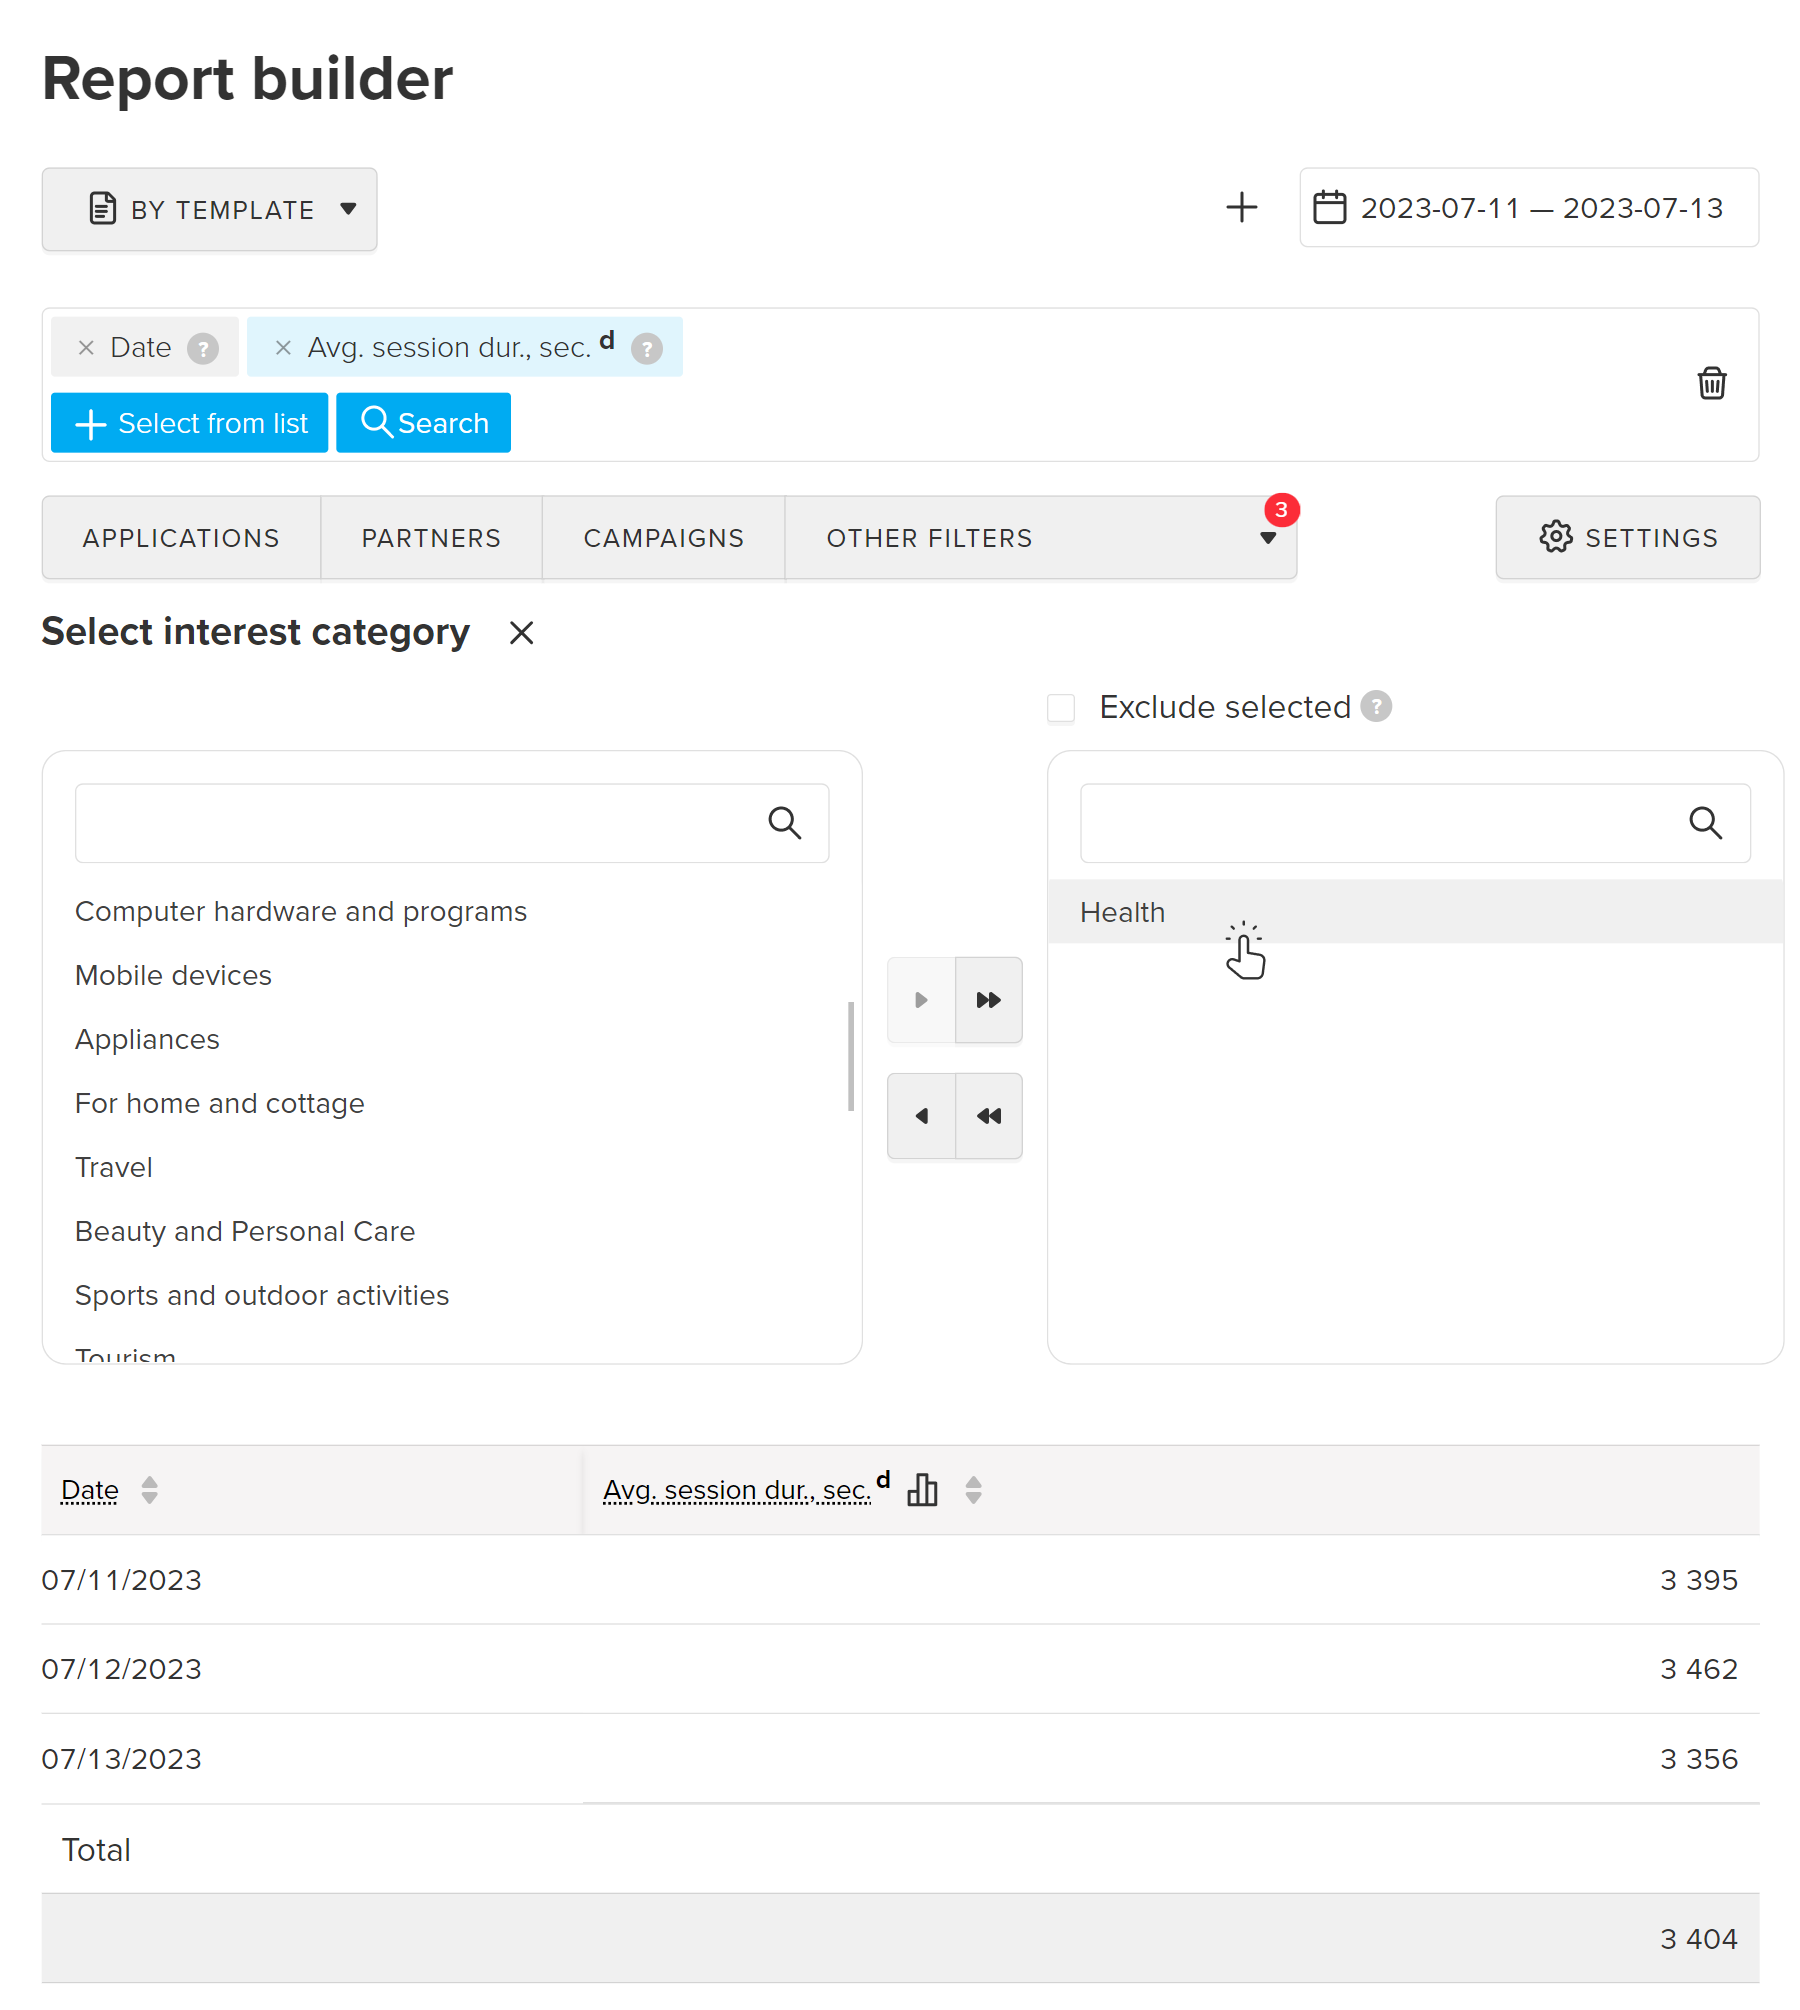
To view stats on user with specific interests, use Other filters → Geo & Demography: Interest category and Interest in the Builder.
For example, check the session duration among users with interest in the Health category.
The affinity index measures the degree of likeness between the interests, socio-demographic, and geo data of your project users and the broader Runet/Internet audience.
Using the affinity index, you can attract more new audiences. For example, select user groups with an index greater than 100% and set up targeted advertising in the VK Ads or other ad partners for this audience.
The affinity index for an interest shows how much your audience's interests coincide with the users' interests of other Runet sites and apps:
Look at the example below of how you can use an affinity index for interests.
The owner of an online store noticed that the launched advertising campaign had become ineffective. Using the affinity index, the owner found out what else his audience was interested in and set up targeted advertising in VK Ads for an audience with these interests:
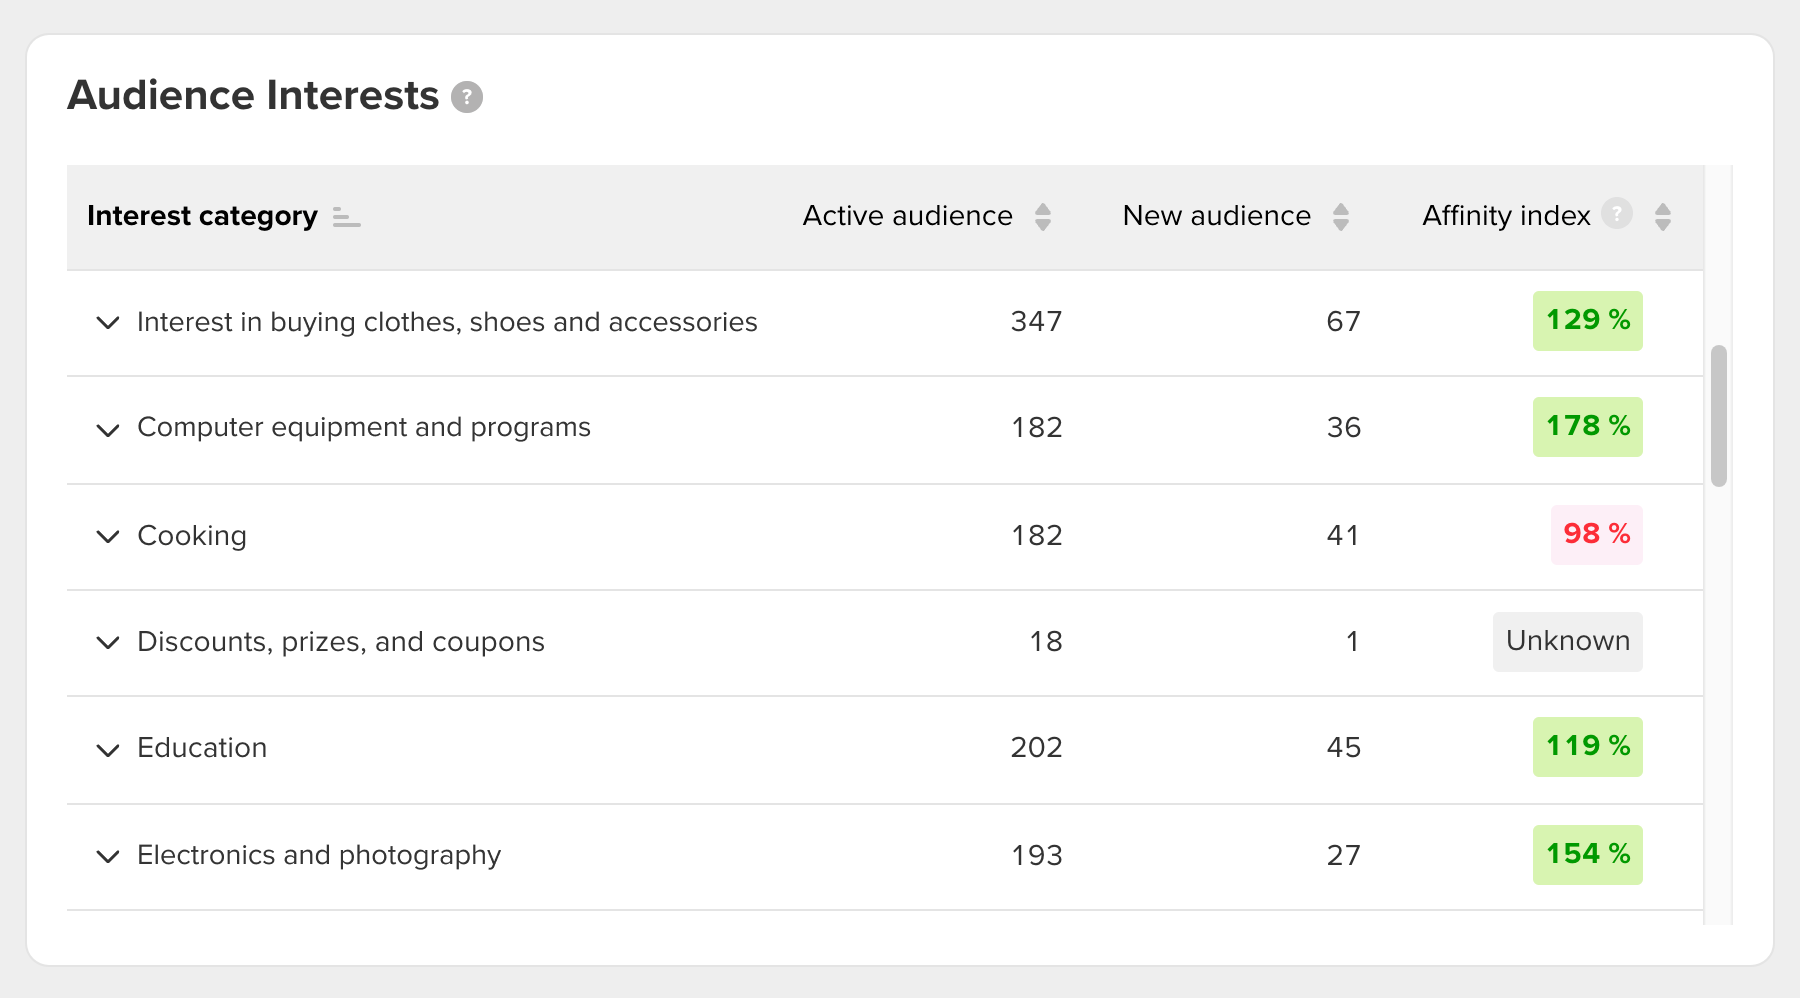
Status Unknown means that there is not enough data to calculate the index
Use affinity indexes for socio-demographic and geo-data to get a more precise idea of what criteria and where to look for a potential audience.
The affinity index for demographics shows the degree of similarity between the socio-demographics of your audience with the Runet audience visiting other sites and apps:
For example, the picture below shows that users aged 25 – 34 visit the selected project more often than users of the same age visit other Runet projects.
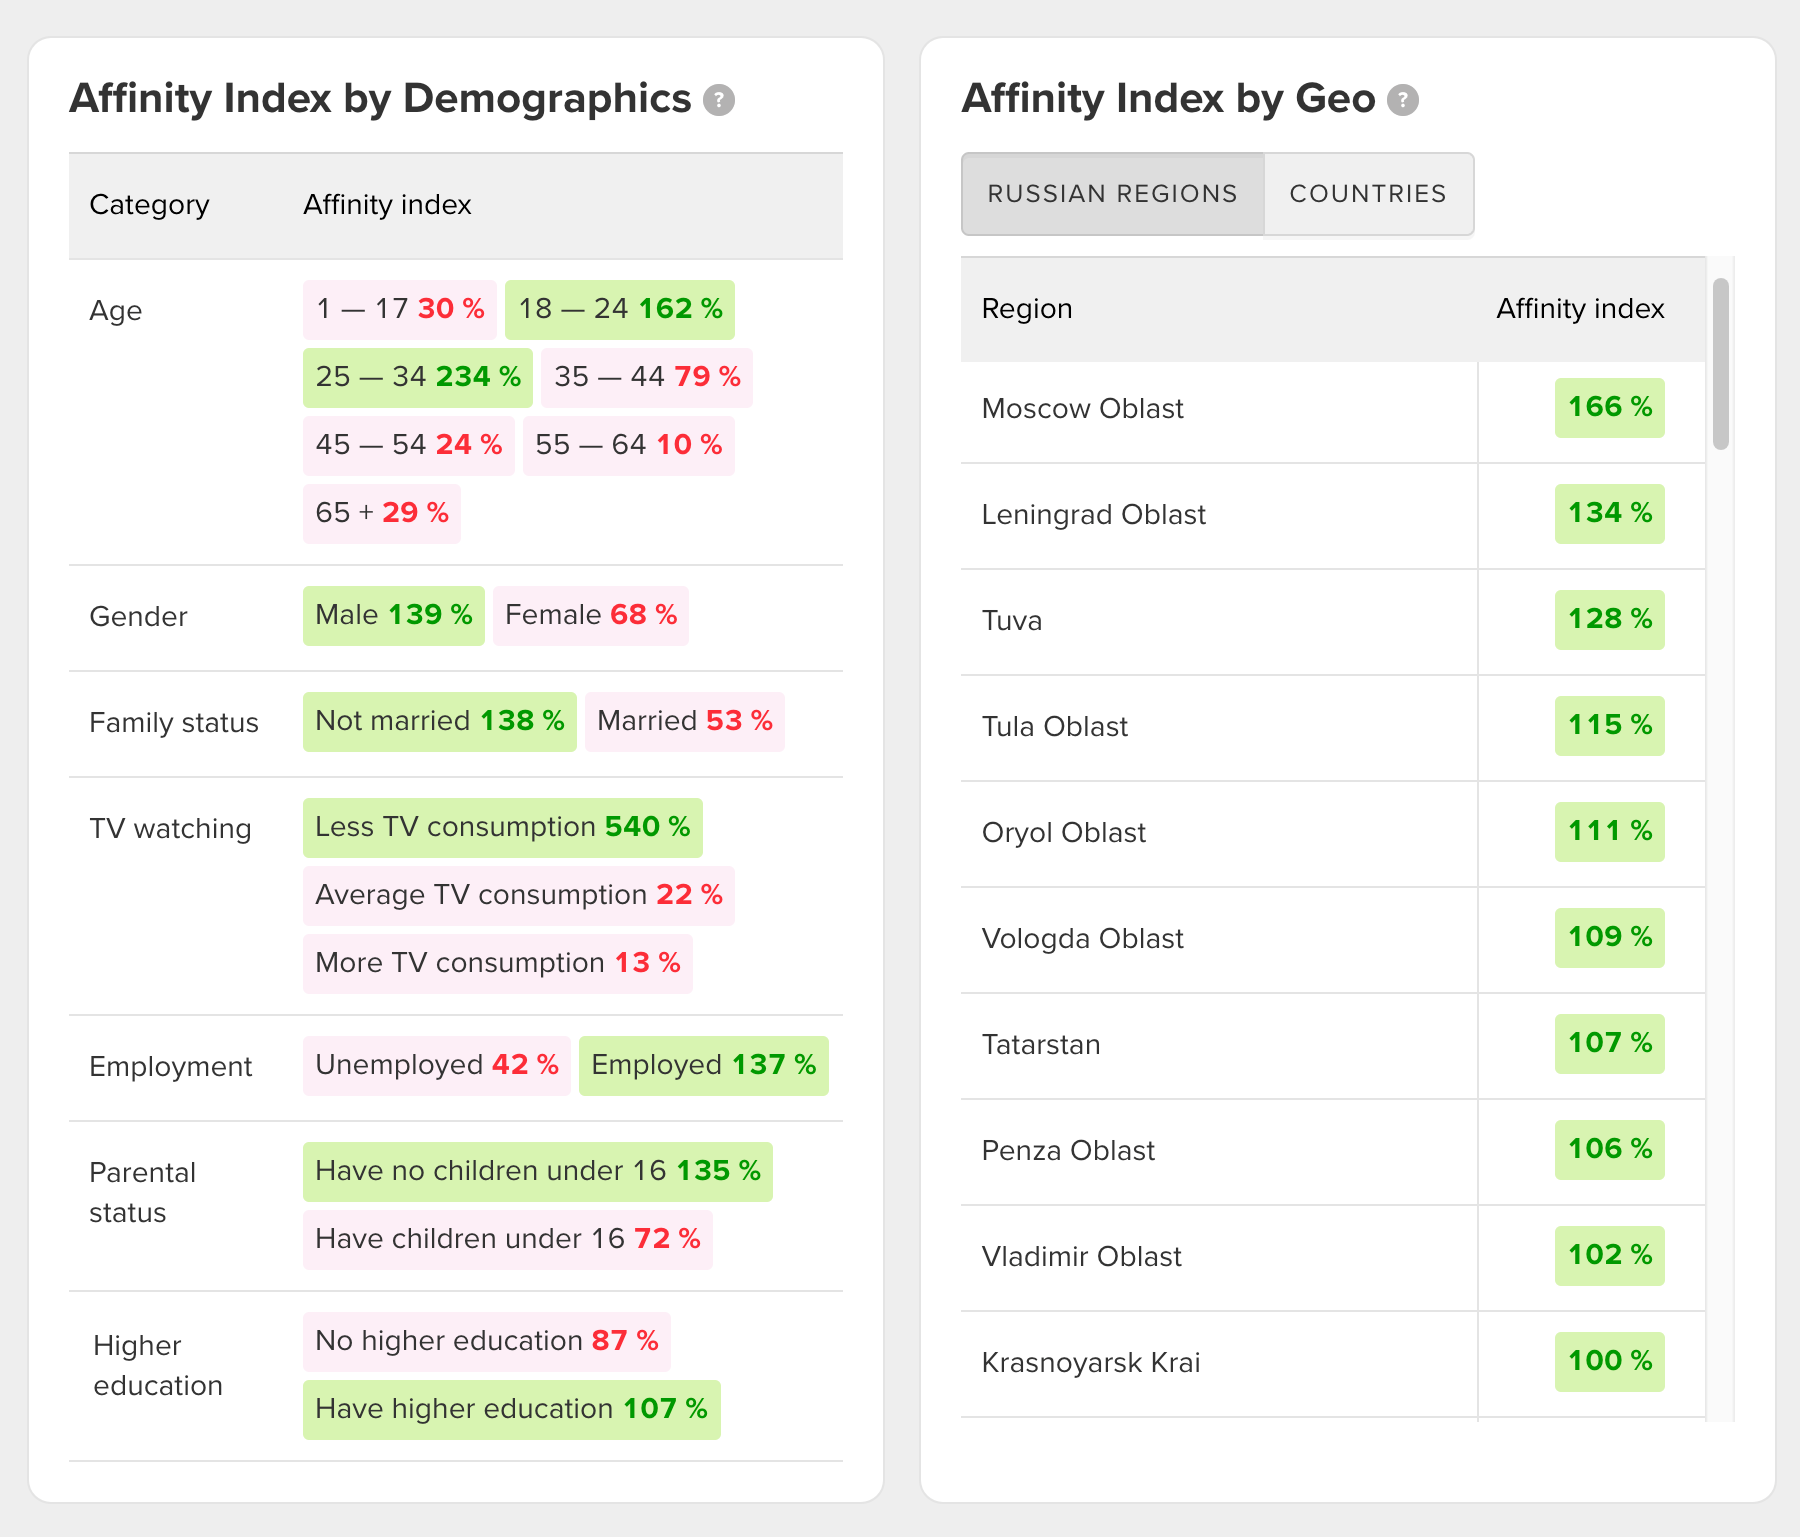
The affinity index for geo shows the degree of similarity of your audience geolocation with the audience of other sites and apps of the Runet/Internet:
For example, in the picture above, the affinity index for the Moscow region is 166%. This means that in this project the share of users from the Moscow region is greater than the share of this region users in Runet.
Use reports Insights to view stats on users who have completed a specific action in your app or website.
Set the Event filter. In the result, all charts and graphs will show the data for the audience, that reached the event in the selected report period.
If you select more than one event, the report will include data that matches at least one of the events.
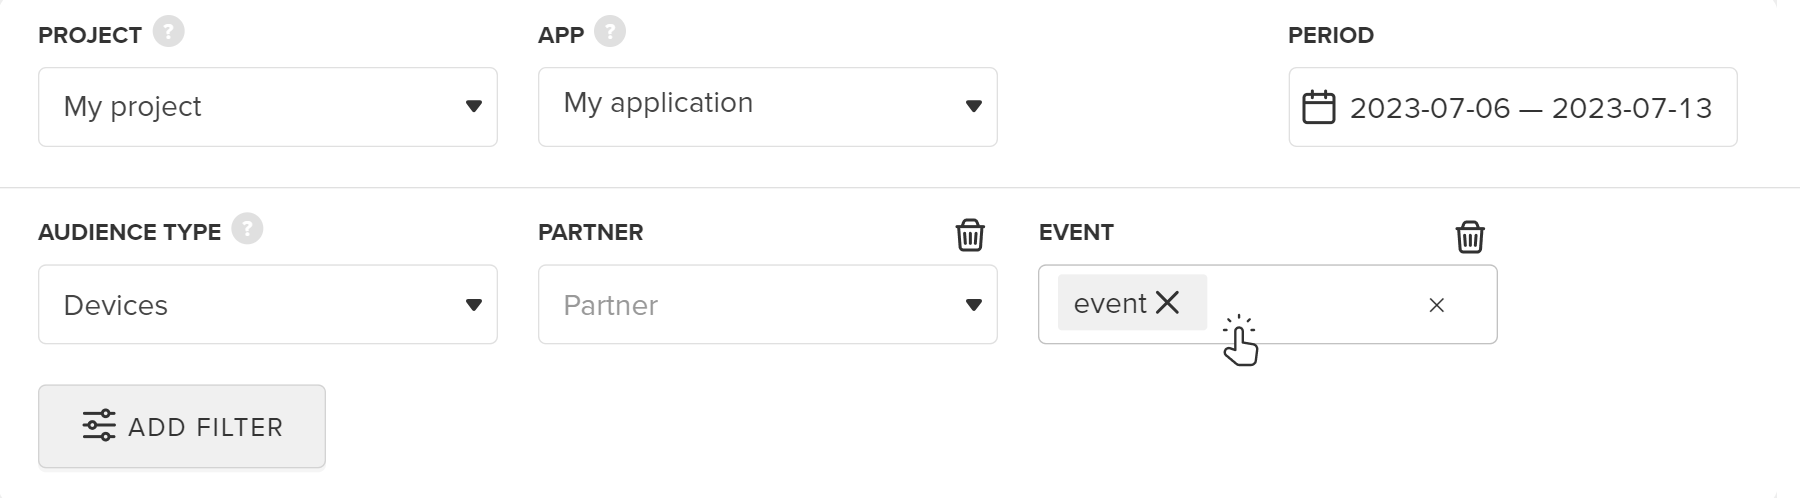
An event can be any custom event