After you add and set up the counter, MyTracker will start to collect stats from your website:
To process and analyze web data, use Reports and Builder. A few examples of reports are given below.
For more information on all tools, refer to the Analytics section
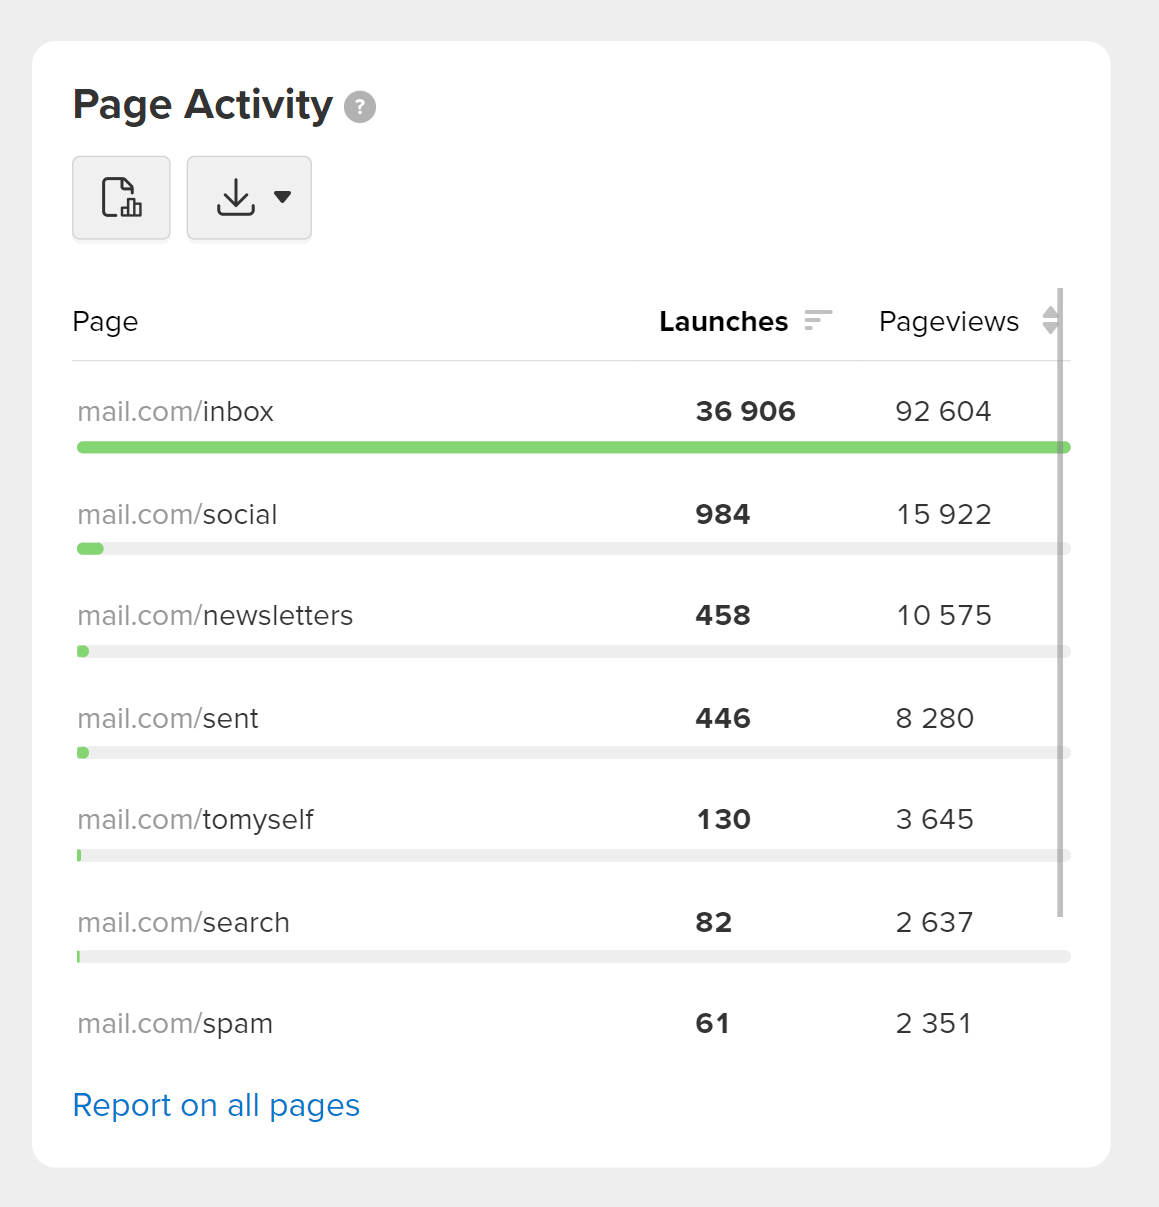
Use the Page Activity report to monitor user activity on each page of your site. The report shows the number of launches and the total number of pageviews.
The launch is a page view when more than 30 minutes have passed since the last page view.
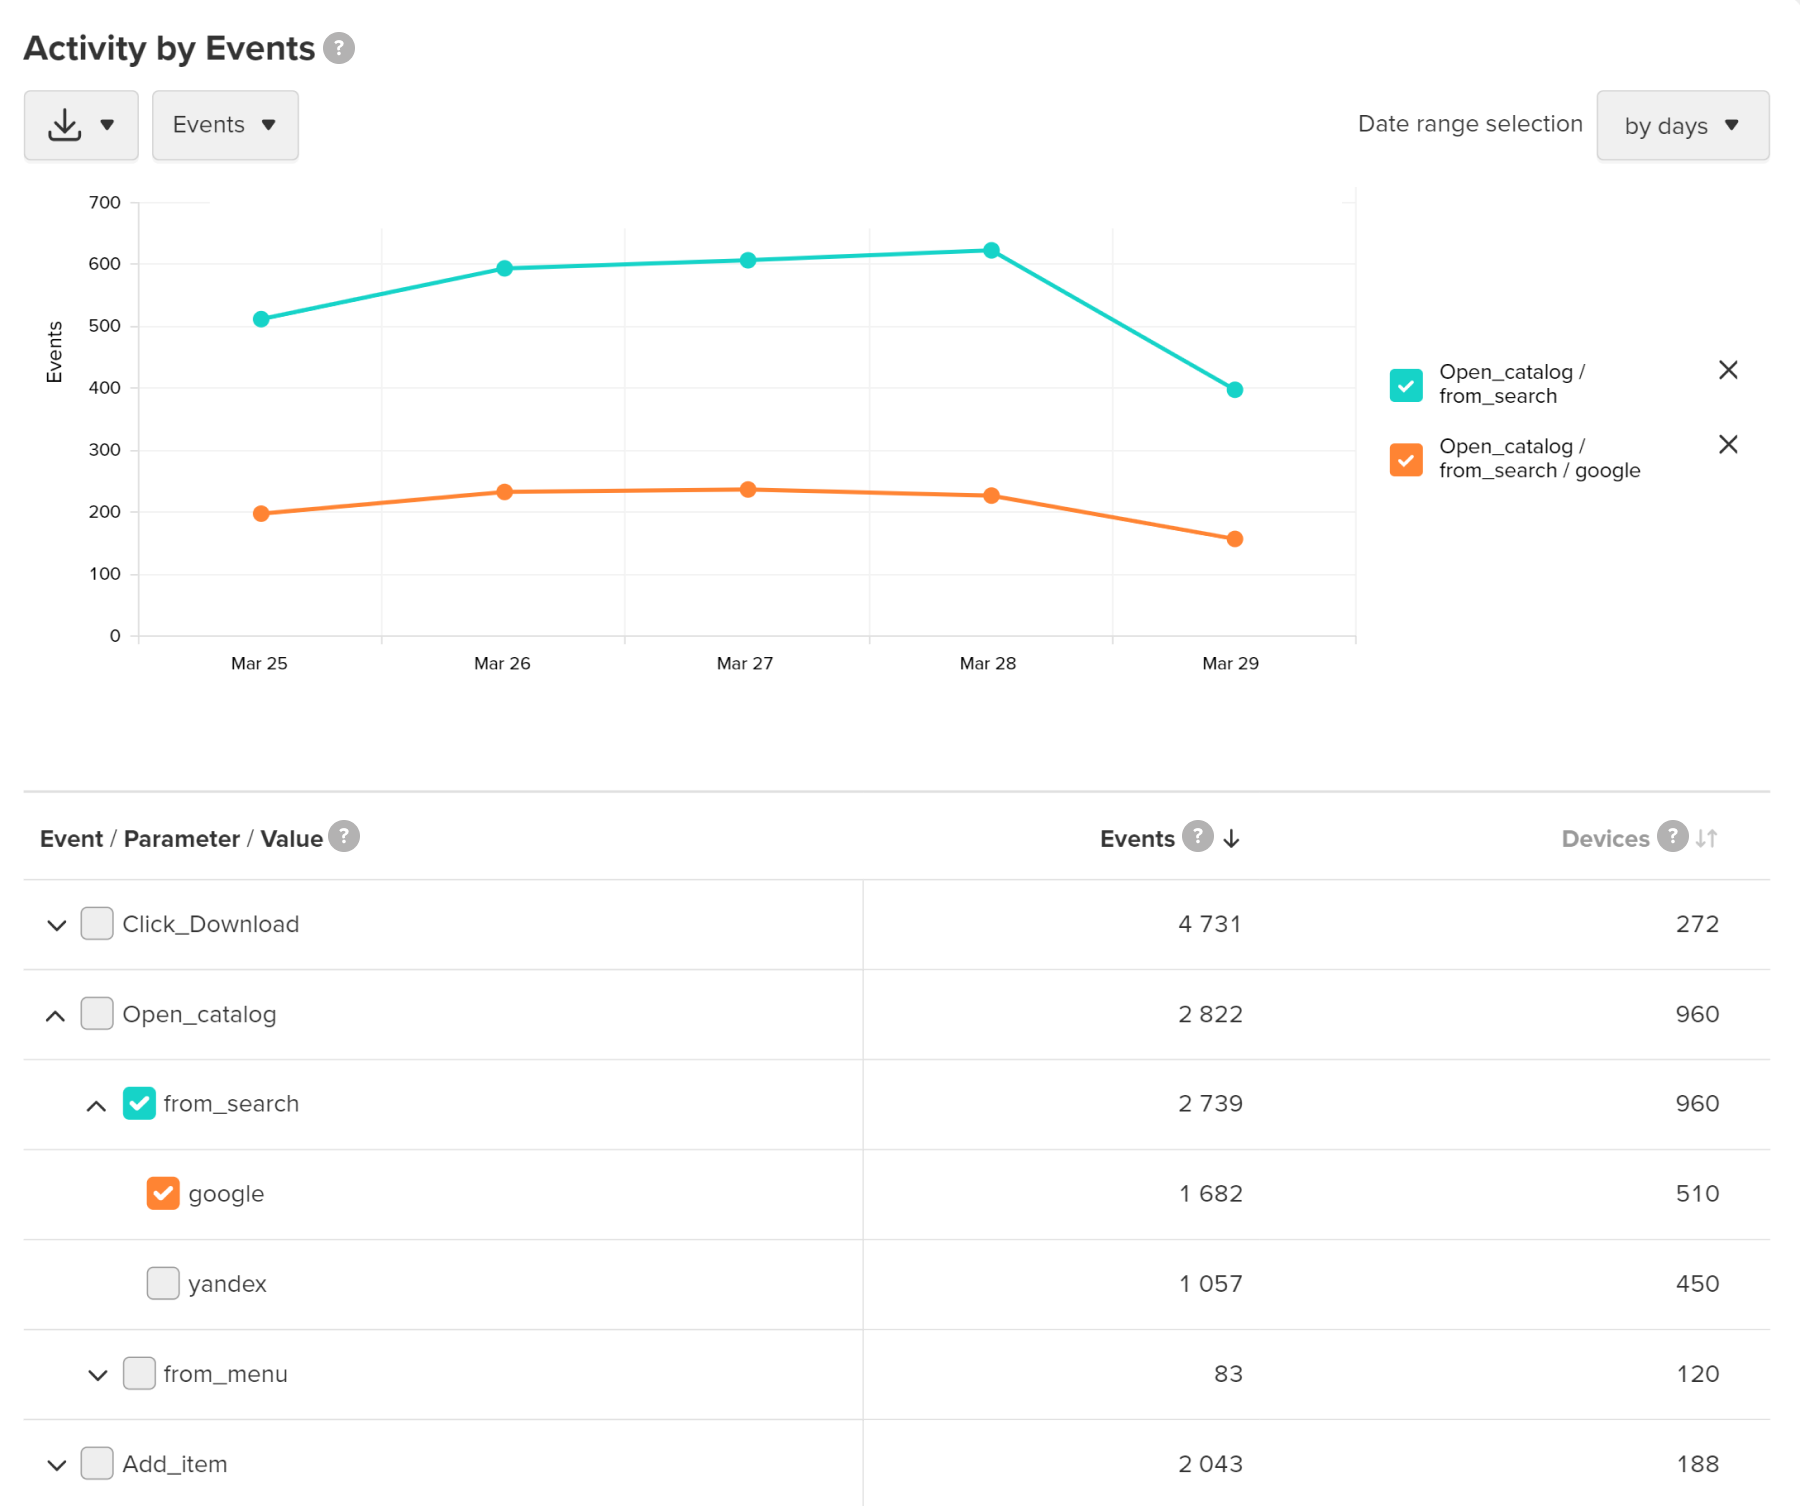
Events (goals) are the user activities sent to MyTracker using JavaScript methods. For example, level achievement or adding to cart. For details, refer to the Track goals section.
Use the Events report to analyze your site events. The report shows the events number and, depending on the selected audience type, the number of devices or users who committed these events. Also, you can analyze data by event parameters.
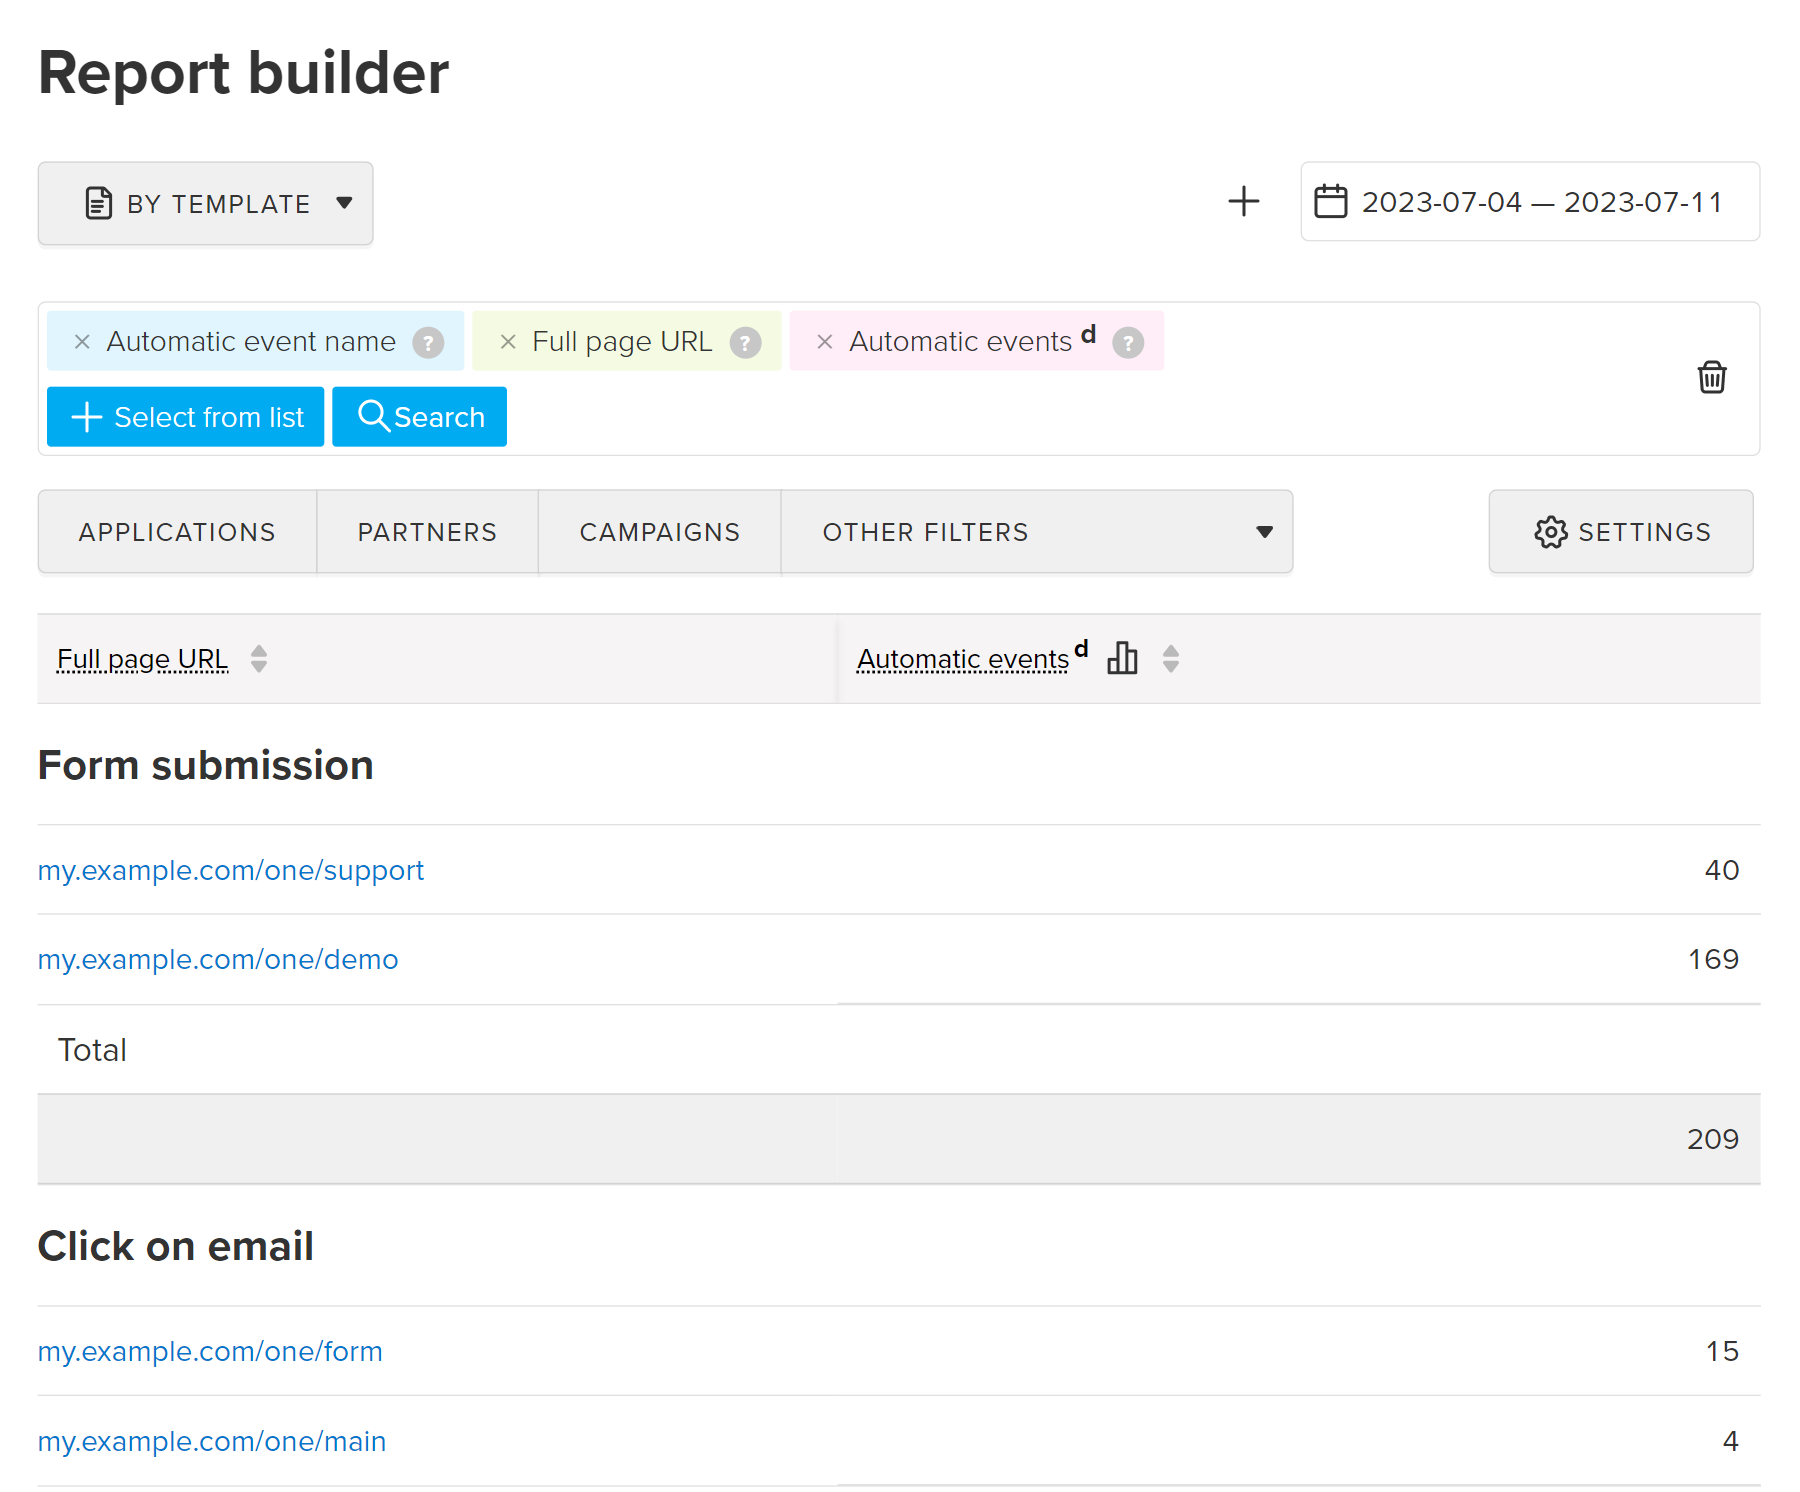
Automatic events are automatically tracked events that do not require you to add any additional code to your website:
To view stats on automatic events, use the Report builder. For example, analyze on which pages events occur more frequently:
UserID is sent with the event, you can additionally select the Automatic events (u) metric.
Use also Other filters → Automatic events to view event-specific data or exclude unnecessary data from the report.
Build a report based on UTM tags:
utm_source;utm_medium;utm_campaign;utm_content;utm_term.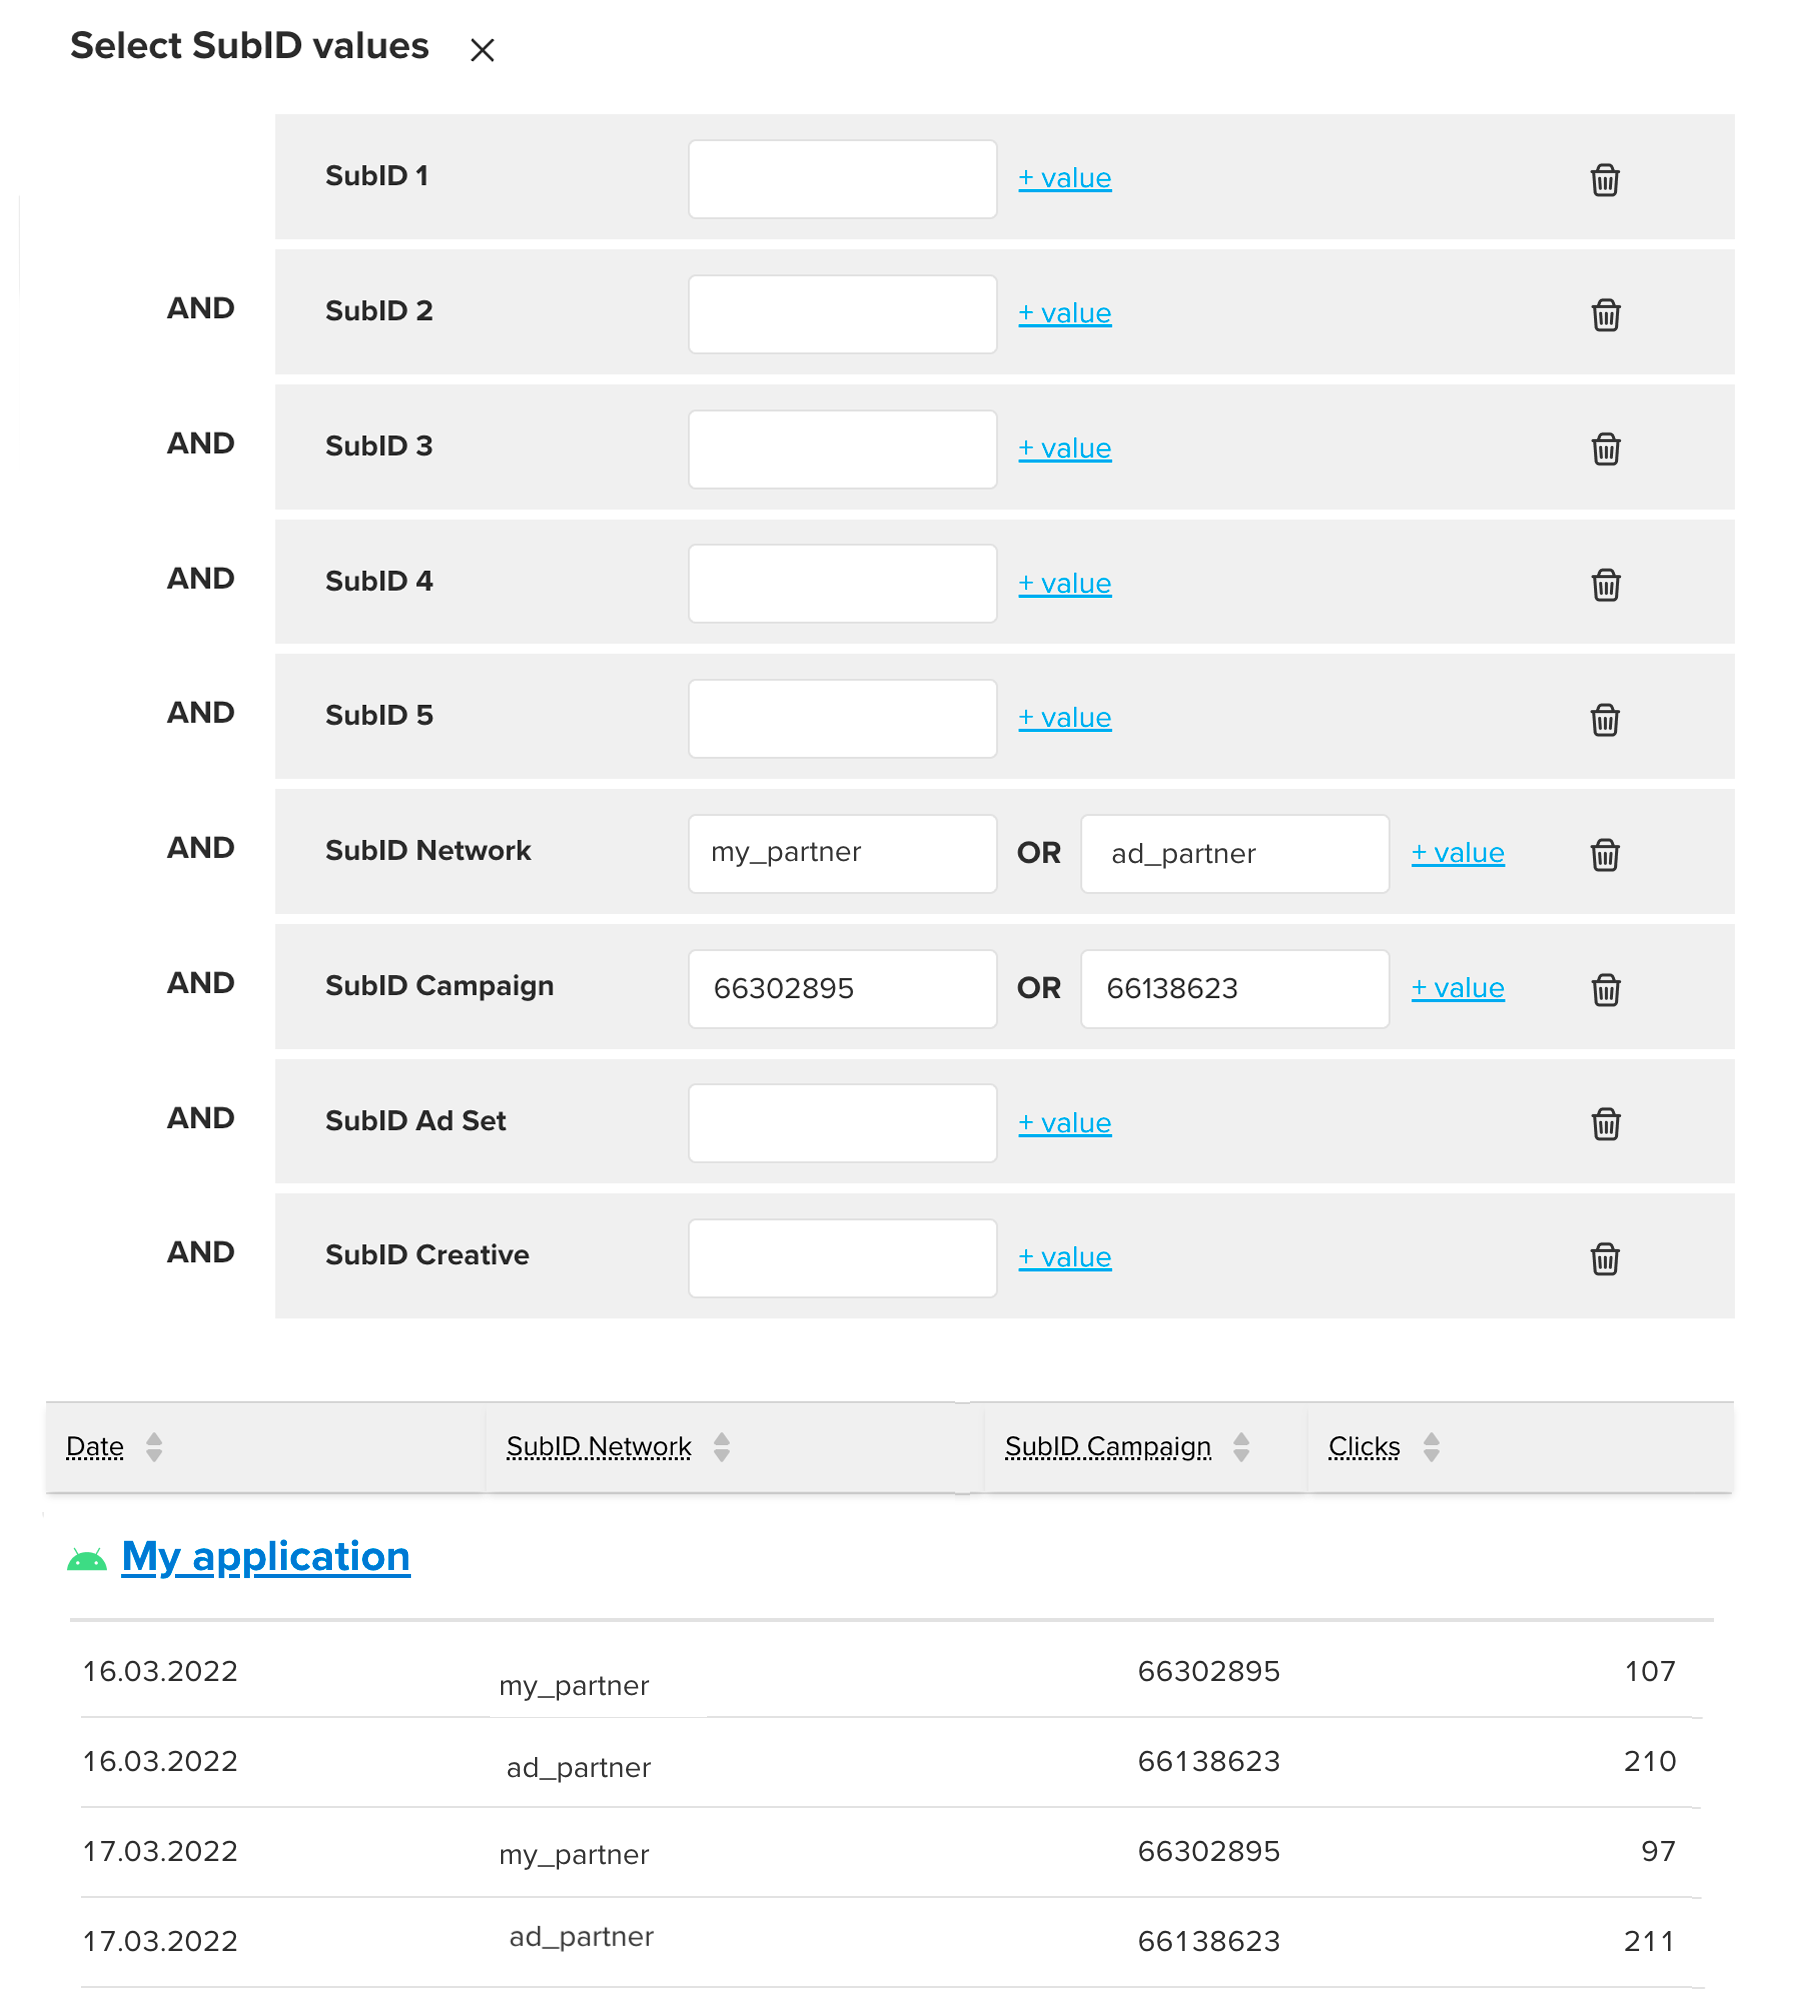
For details, refer to the UTM traking section