To analyze the calculated funnel, click on its name in the funnels list. The funnel calculation result in MyTracker can be presented in the form of a chart or a summary table, and also shown in the status. You can edit and duplicate the funnel, as well as export it's data.
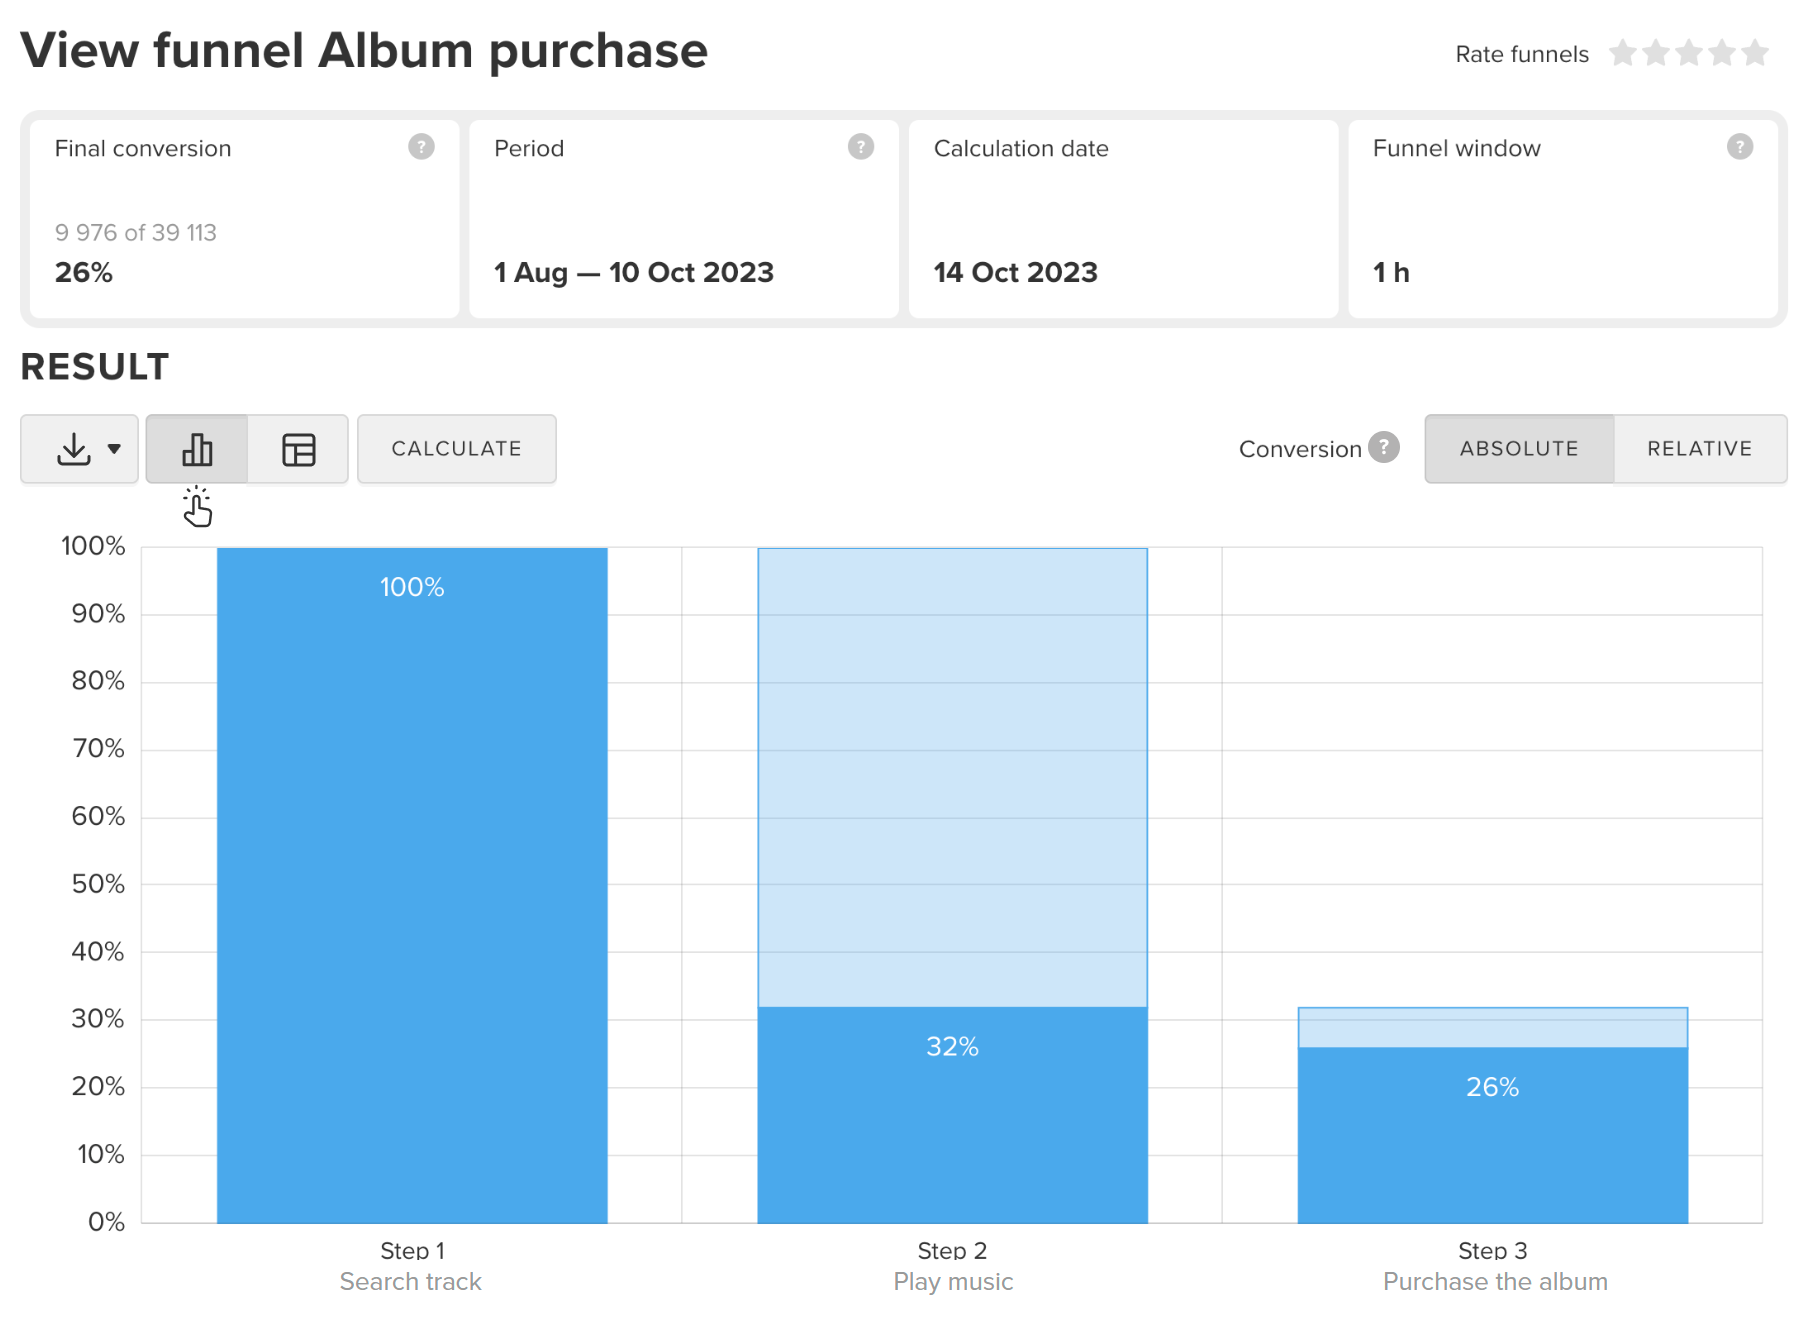
The calculation status and the final conversion of the funnel are displayed both in the funnels list and on the funnel view page. For example, in the picture below:
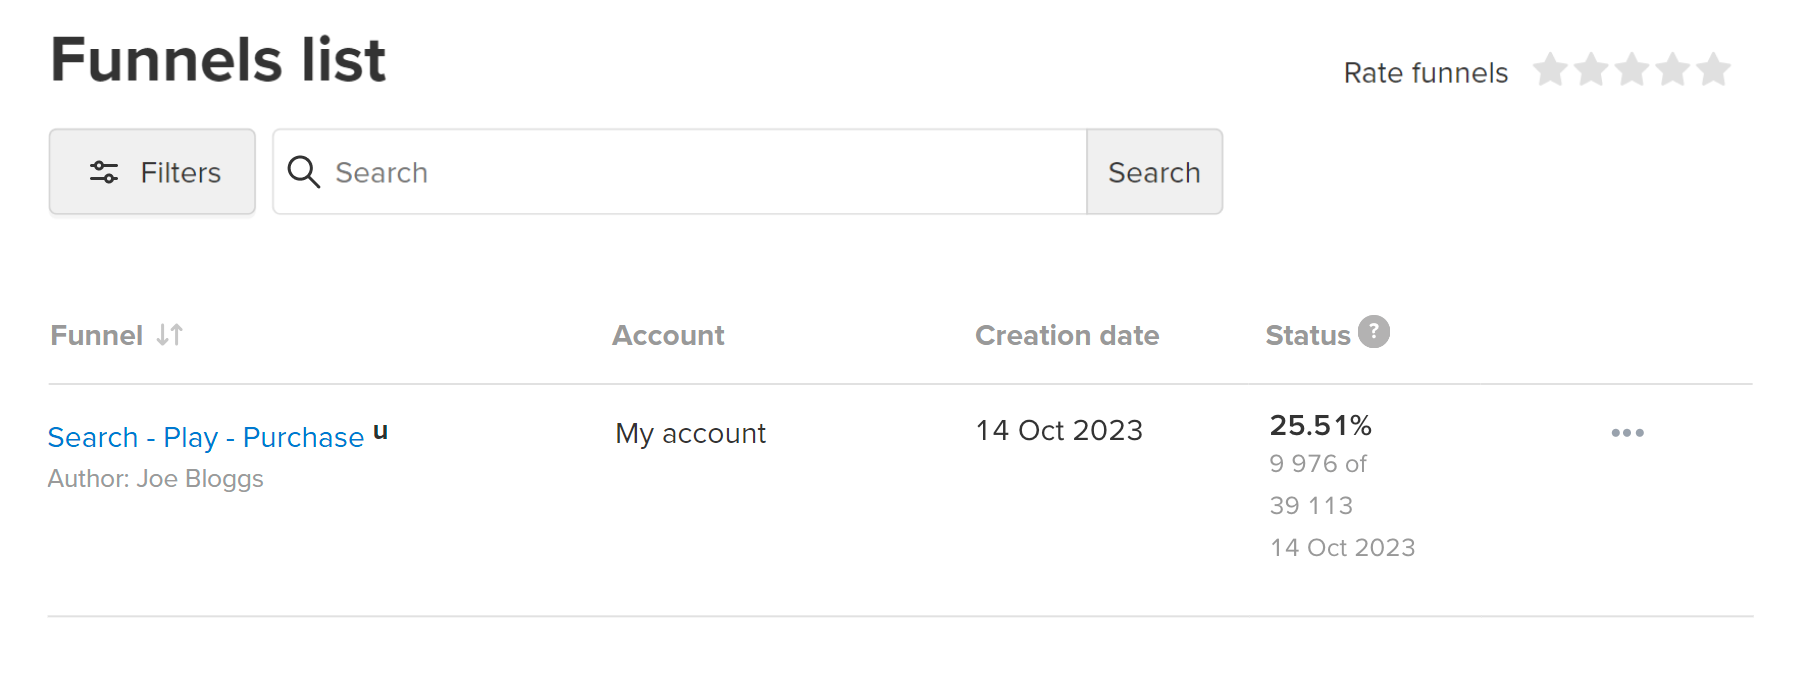
The calculation status can be as follows:
Funnel conversion shows the share of users who have completed some actions on the site or in the app. The conversion rate is displayed on the MyTracker chart and table at each funnel step, as a percentage and as a number.
Absolute conversion shows what share of users moves from the first step of the funnel to the target step. Absolute conversion in the first step is always 100%. With each subsequent step, MyTracker shows the share of the users from that 100% who completed the subsequent action.
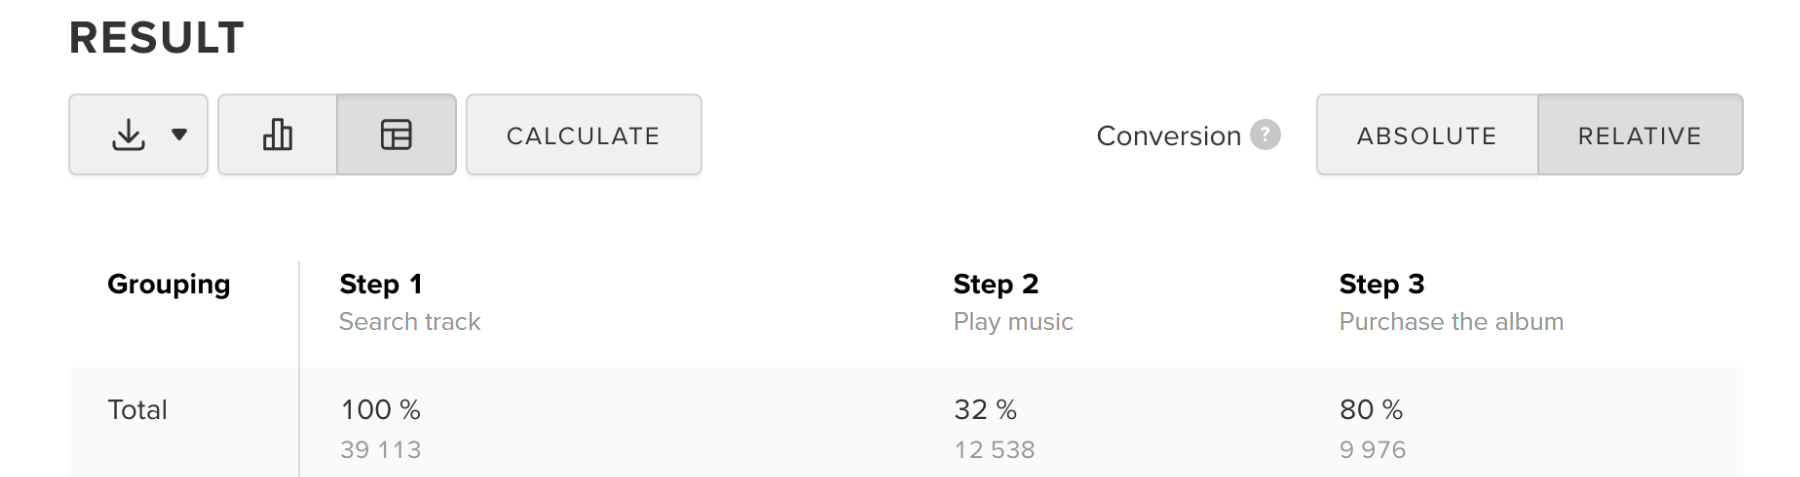
For example, in pictures below, out of 39 113 users, only 9 976 (26%) made a purchase.
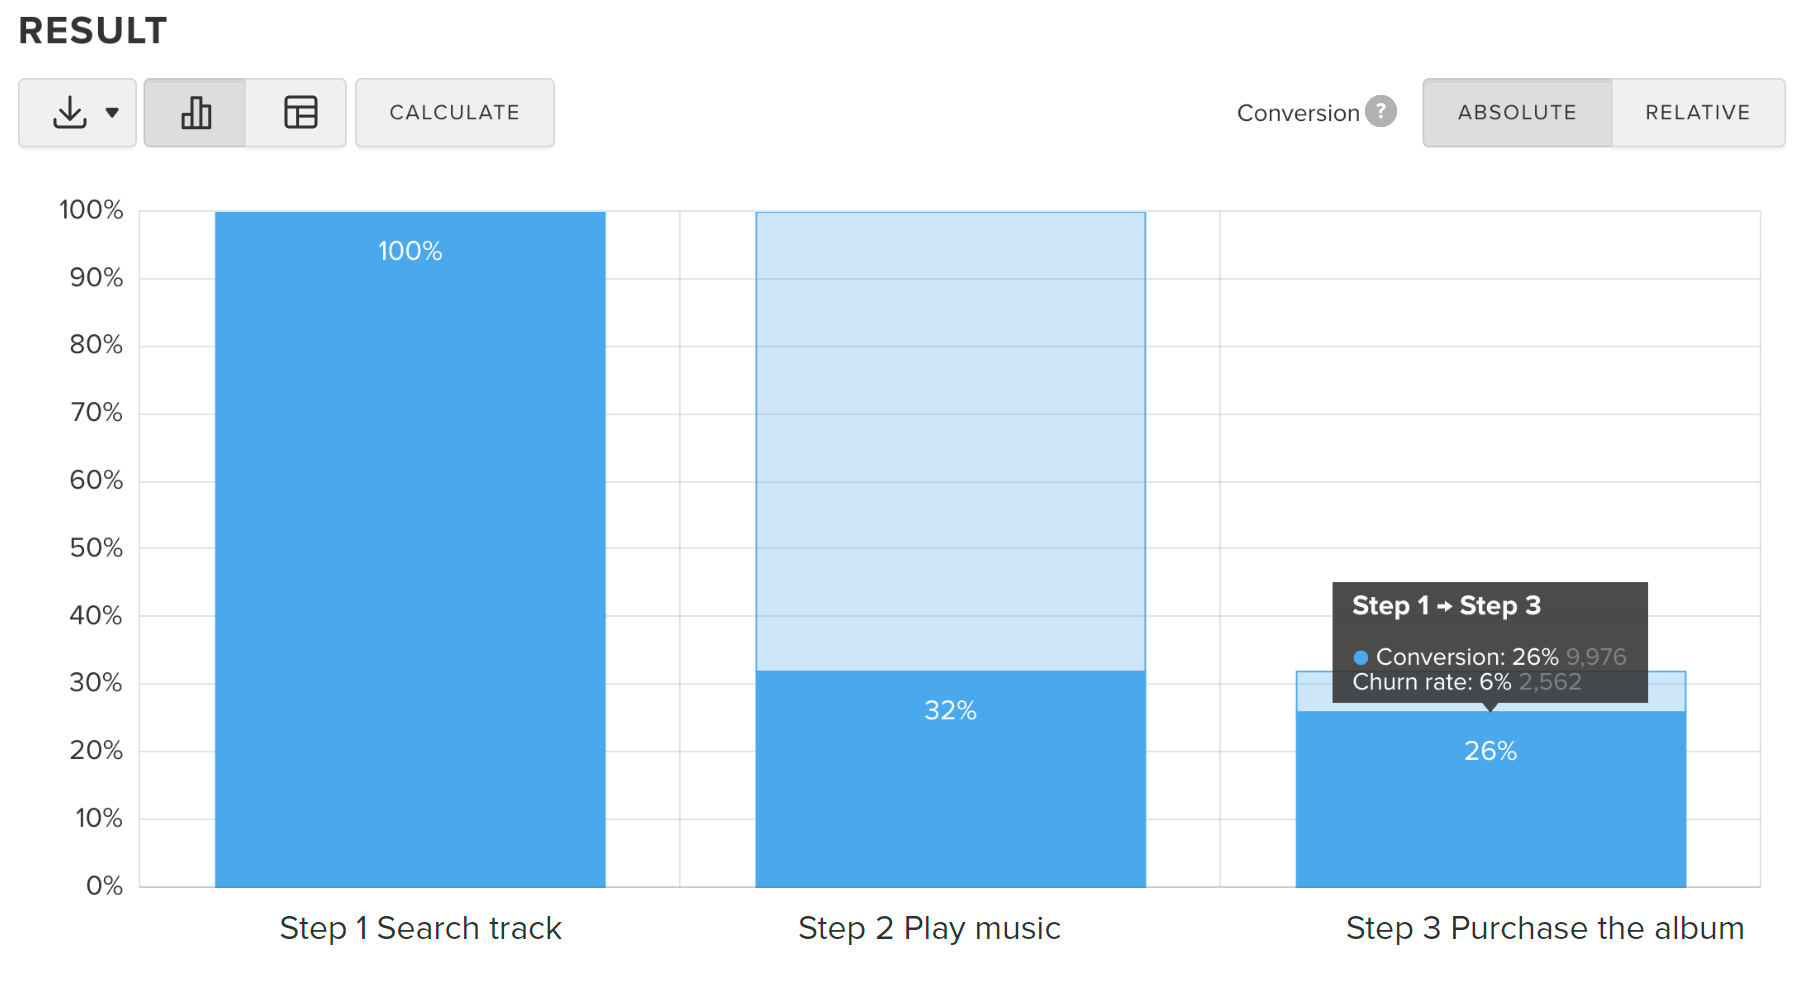
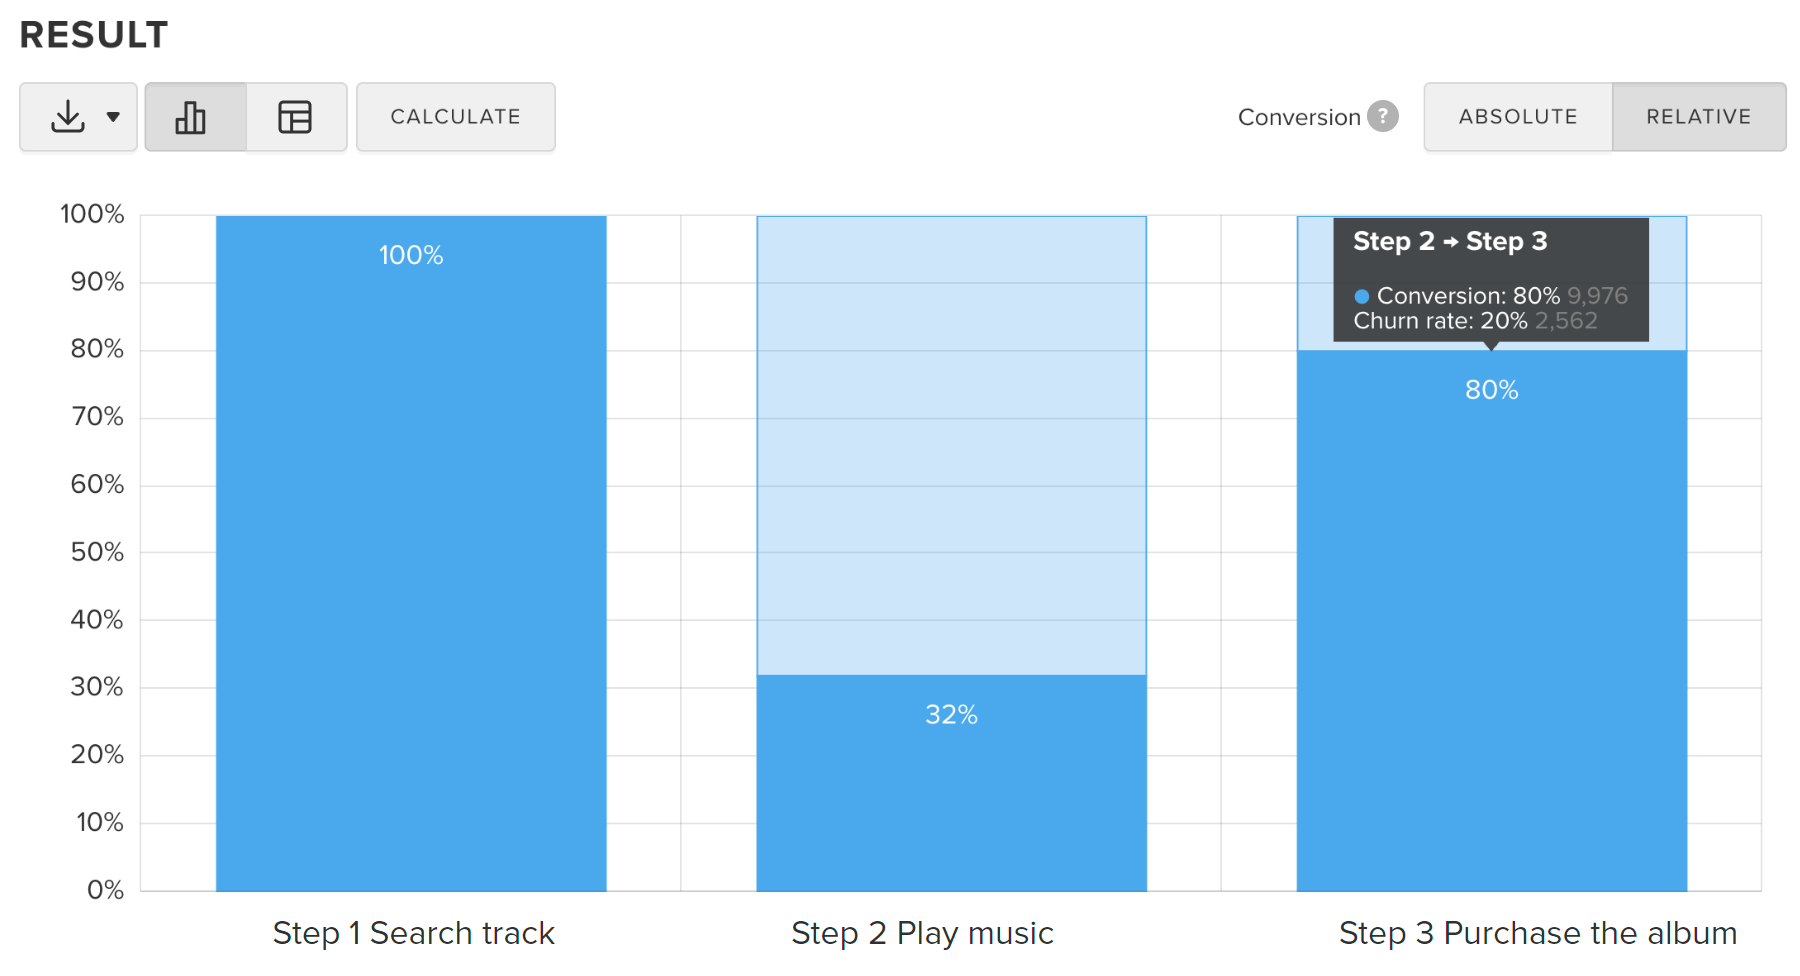
Relative conversion shows what share of users moves from one step of the funnel to the next. Relative conversion in the first step is always 100%. With each subsequent step, the share of users who completed the subsequent action is shown relative to the previous step. Conversion results comparison between steps allows you to identify areas in the product that require optimization.
For example, in pictures below, out of 12 538 second step users, 9 976 (80%) third step users made a purchase.
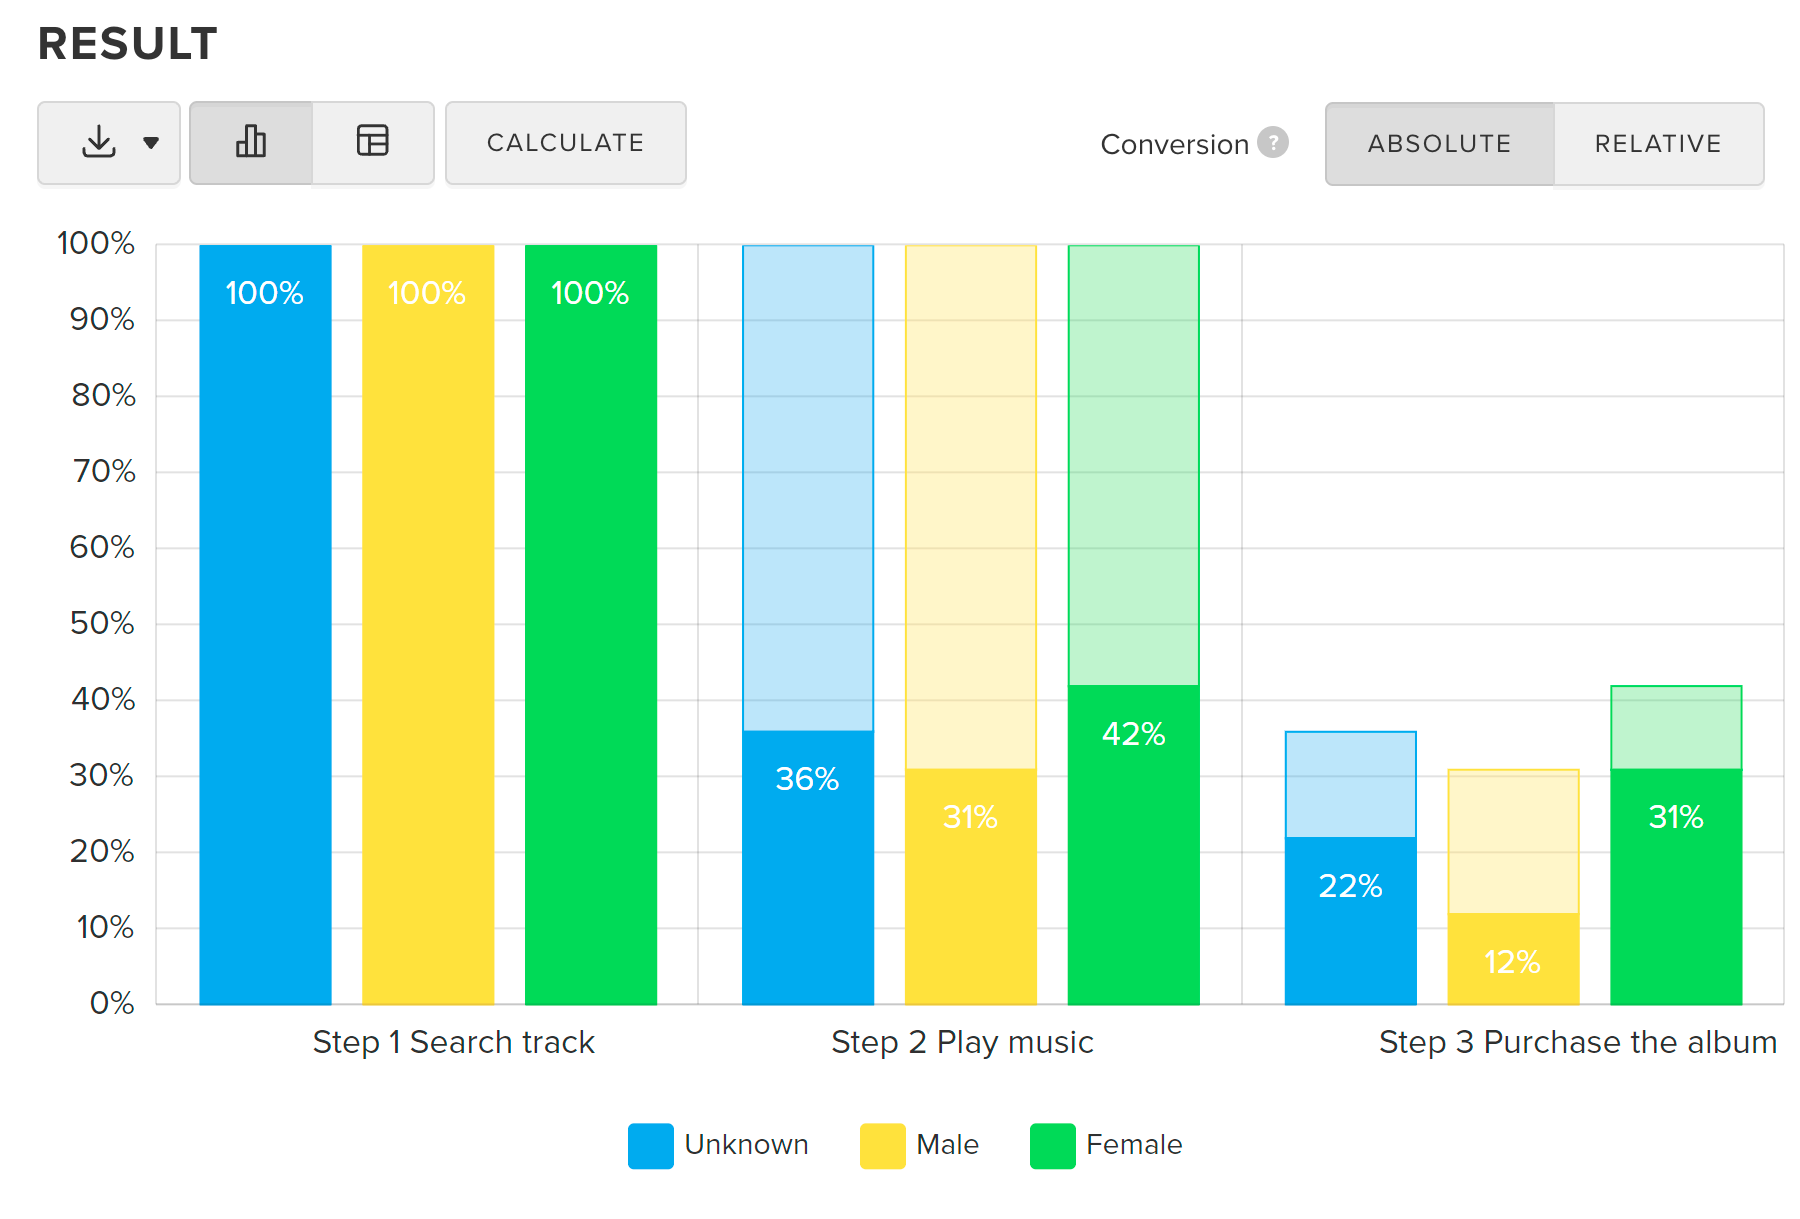
The data grouping allows you to compare conversions for different groups of users or by various traffic sources. For example, you can group data by apps on multiple platforms, by the gender of the audience, or by ad campaigns. Each group will be marked with a different color on the chart.
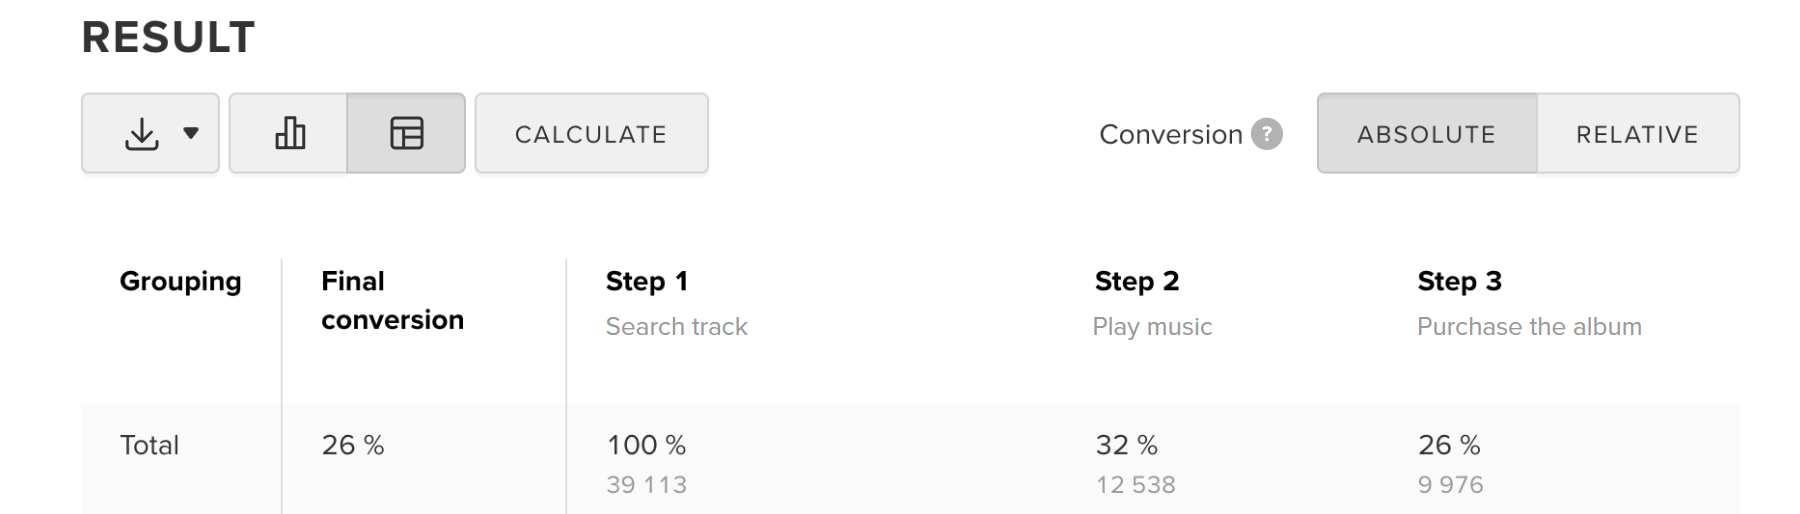
You can switch to the table view and in the Total table line you can see the final conversion for the whole funnel without groups.
Untracked values are assigned to the Unknown group. For example, due to user privacy settings, geo-blocking, and so on.