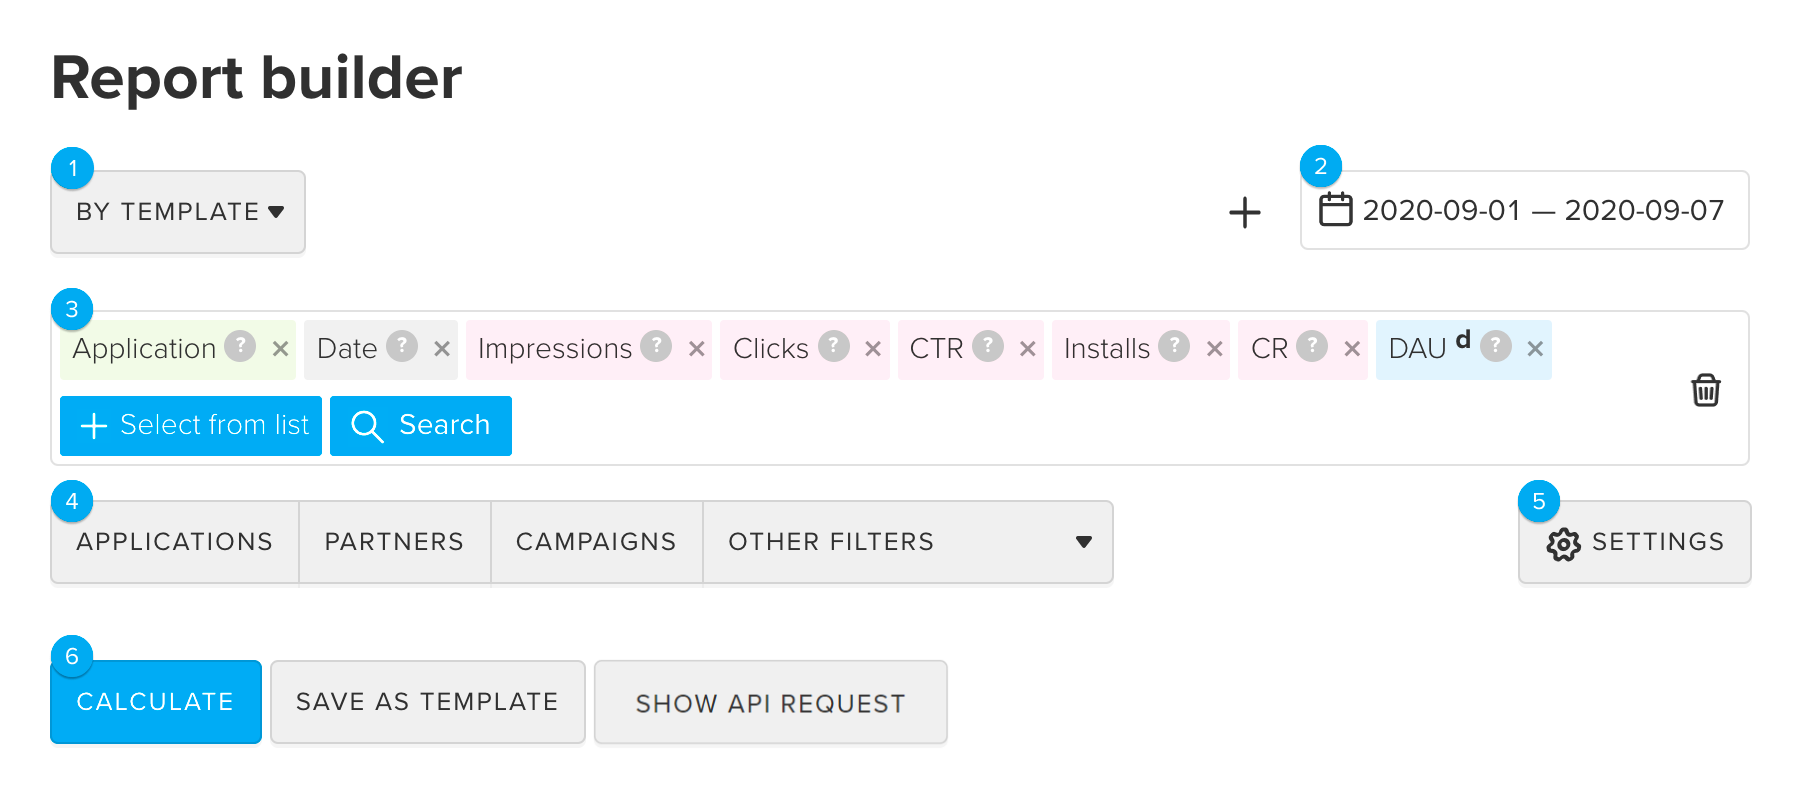
The Report builder is MyTracker's key analytics tool, which helps to arrange and view collected data in a handy format.
It features the AI assistant (1), calendar (2), selector list (3), filters (4), additional settings (5), and control buttons(6).
Combine the builder elements as you like: use the AI assistant to automatically generate reports, change ready-made templates, create a report by segment, or manually set all parameters.
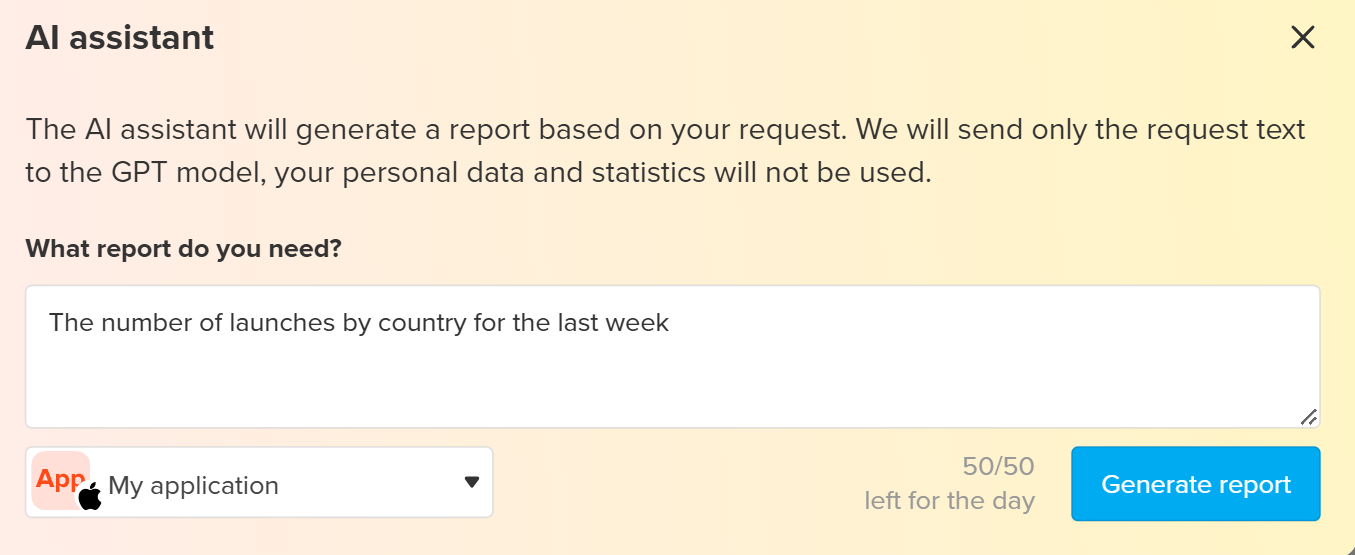
In the Builder, click the AI Assistant button and write what report you need. For example:
"The number of launches by country for the last week"
"Registrations in Russia by region"
"Clicks and new devices from VK Ads and Yandex Direct partner"
"Number of custom events EVENT_NAME1,EVENT_NAME2 for November"
You can request reports on any metrics and dimensions but use a limited set of filters:
The request history is saved, so you can return to recent reports or reuse the request text.
The AI assistant can make mistakes. We recommend using the tips in the report to check that the metrics are selected correctly.
You can select a ready-made template, which saves you the need to set filters, selectors, etc. Just go to the Templates page, select a default template or a previously added template from the list, and the report will be generated. You can also edit the template, for example, by adding new selectors and filters.
Use pre-made templates as a basis for new reports
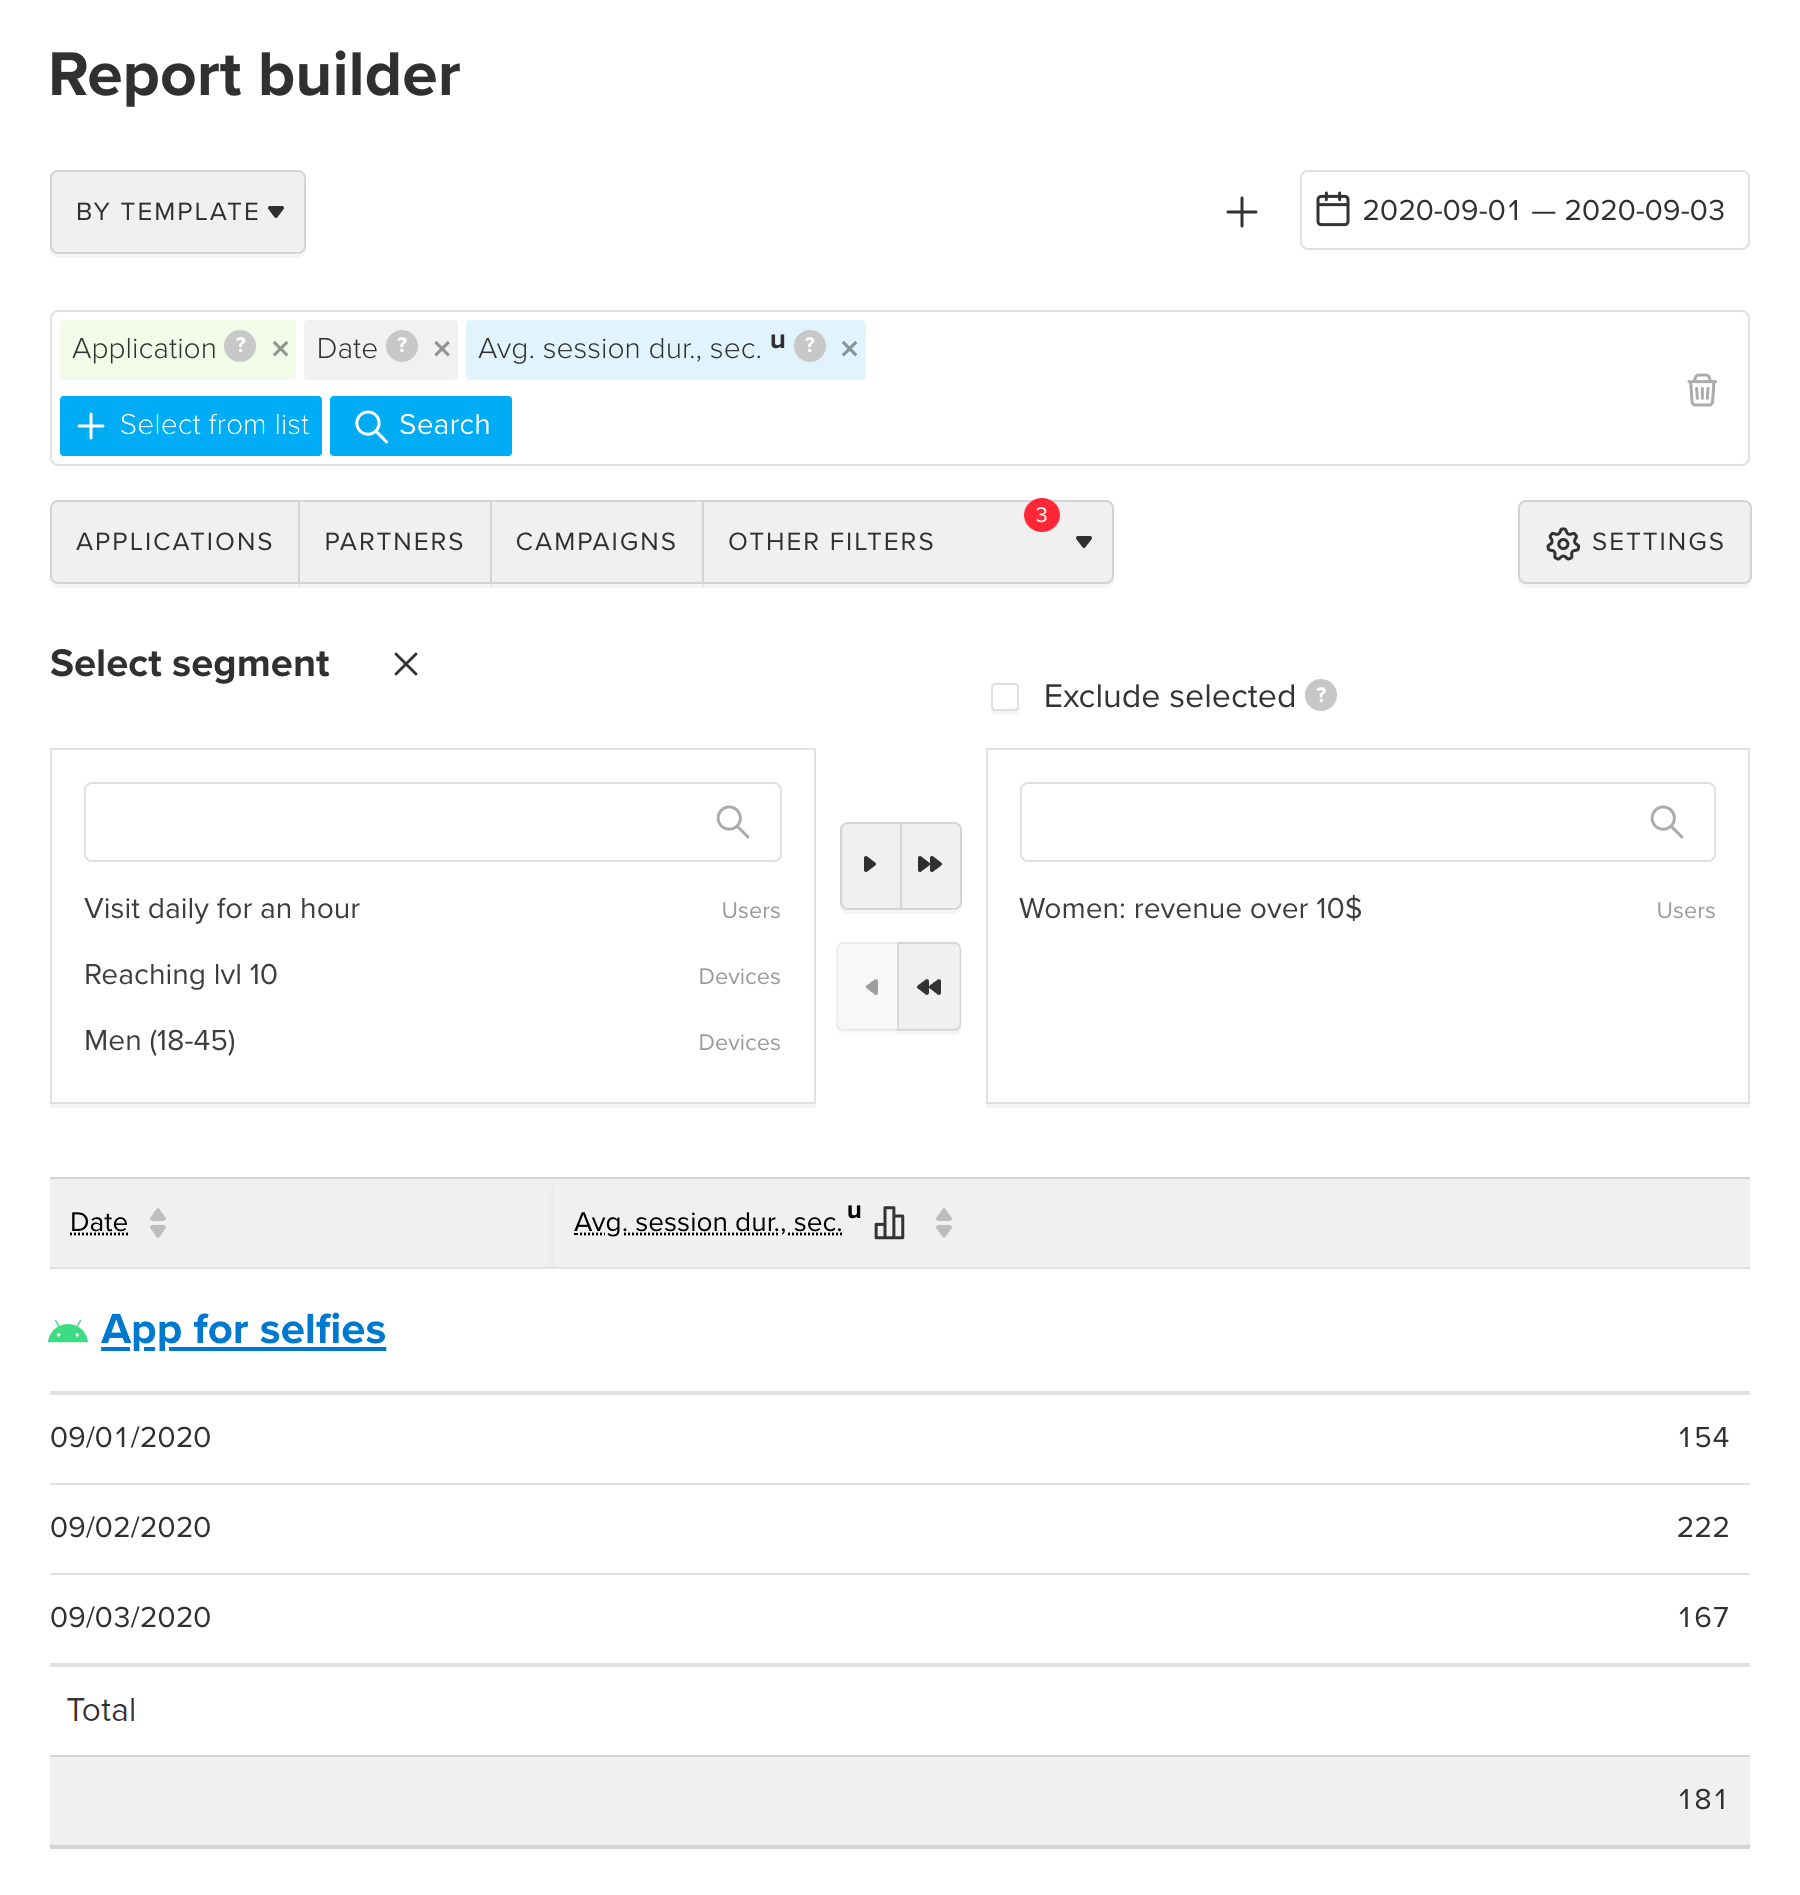
Specify a segment, i.e. a group of users for which you want to build a report. For example, women who brought in the revenue of more than USD 10 over the last 30 days. You can add other selectors such as the average session duration.
To build a report by segment, select Other filters > Segment.
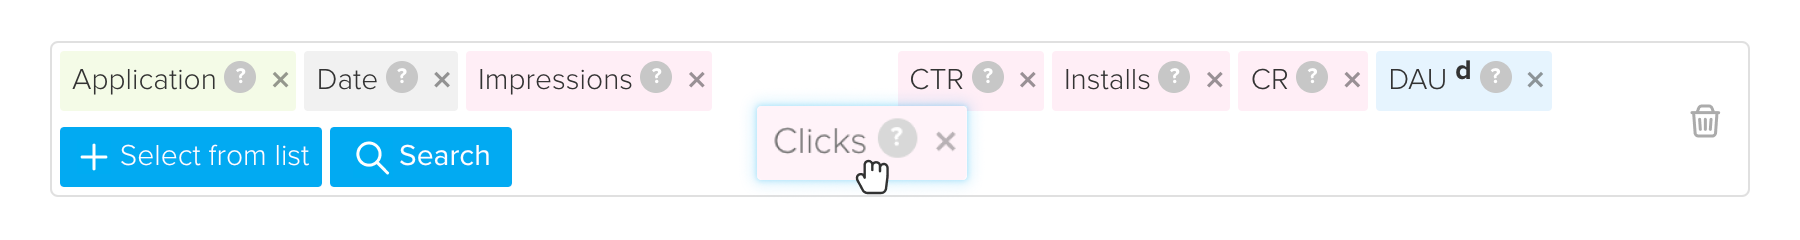
To change the order of columns in the report, drag and drop selectors relative to each other

The payment verification filter ( Other filters > Financial metrics > Verification) is set by default. It's necessary to exclude unverified purchases (fraud and test transactions) from the reports. For more details, refer to the Payment verification section.
The report is ready. You can choose to download it as an XLSX or CSV file, save it as a template and subscribe to a report.
If the report has more than 20000 cells and cannot be properly viewed in the browser, MyTracker will offer to save it as an XLSX file
MyTracker allows you to build and download a chart for metrics used in the report.
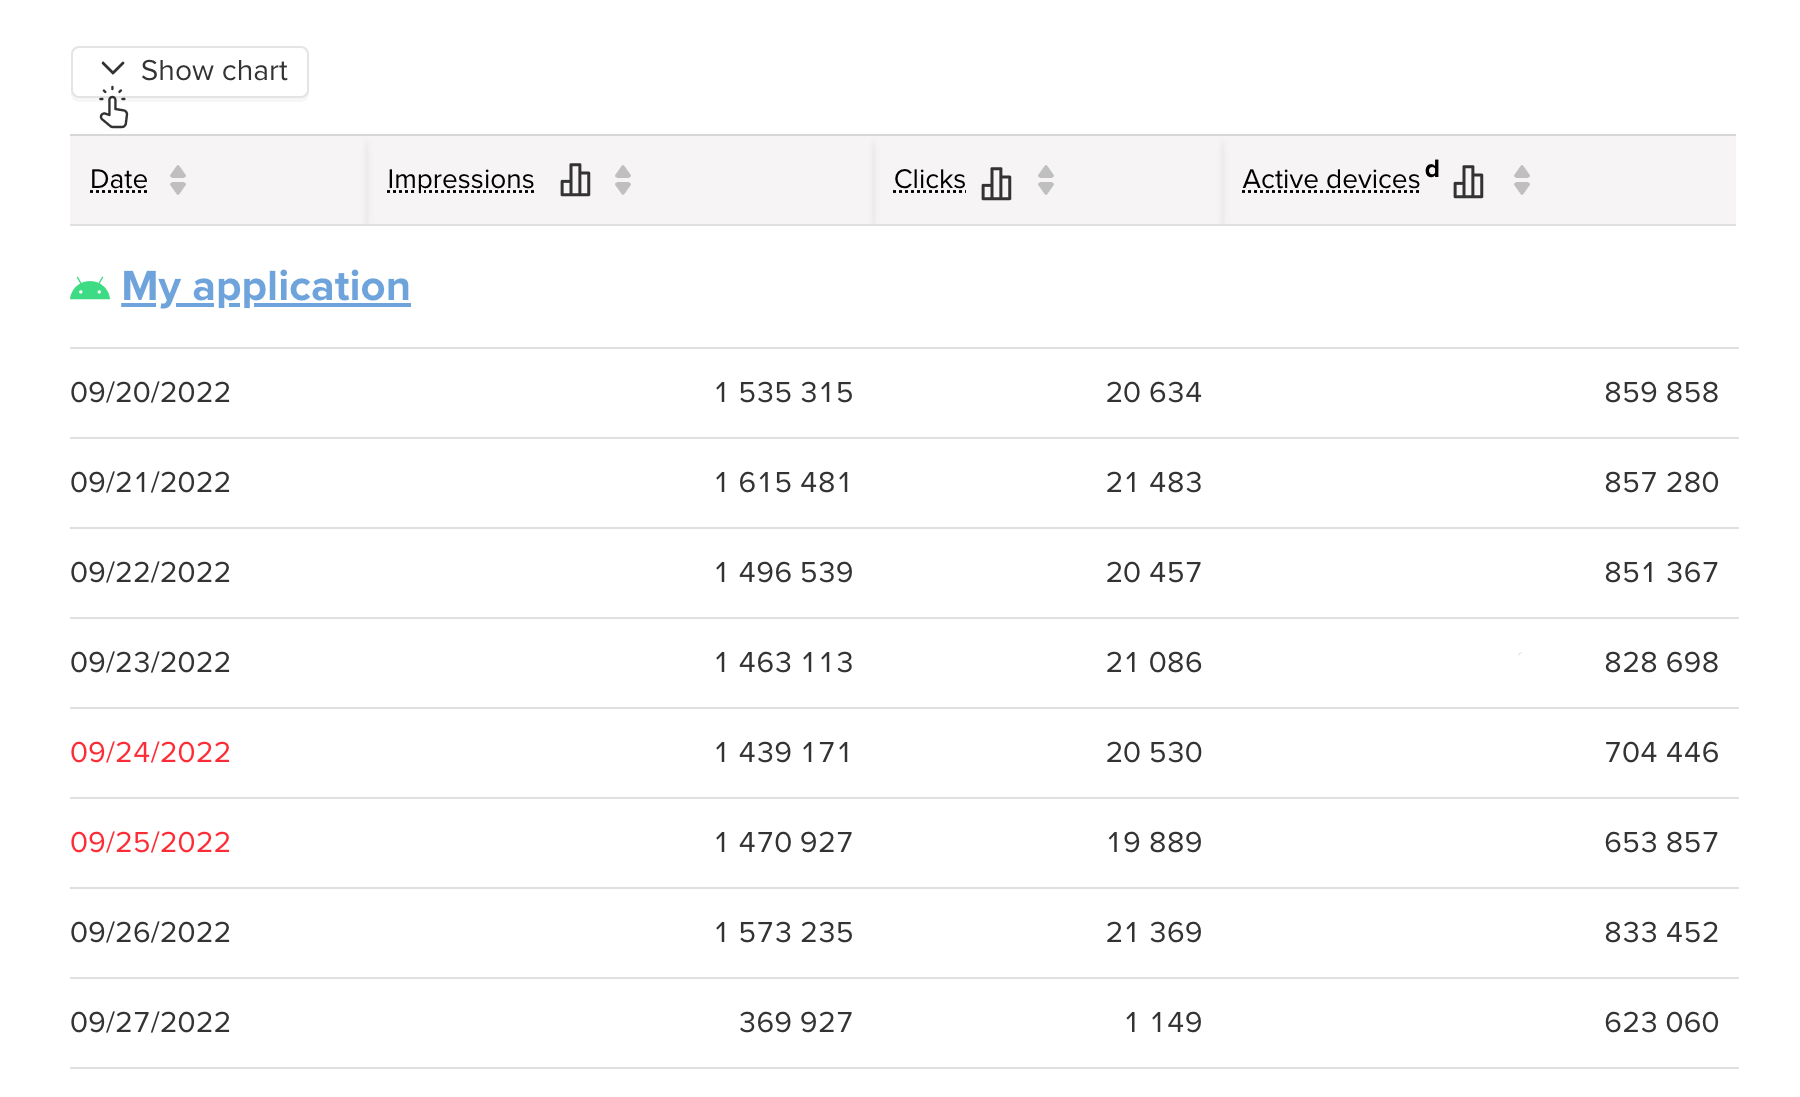
The chart will be built based on the first column values with the metric. You can add other metrics to the chart using the button in the table header.
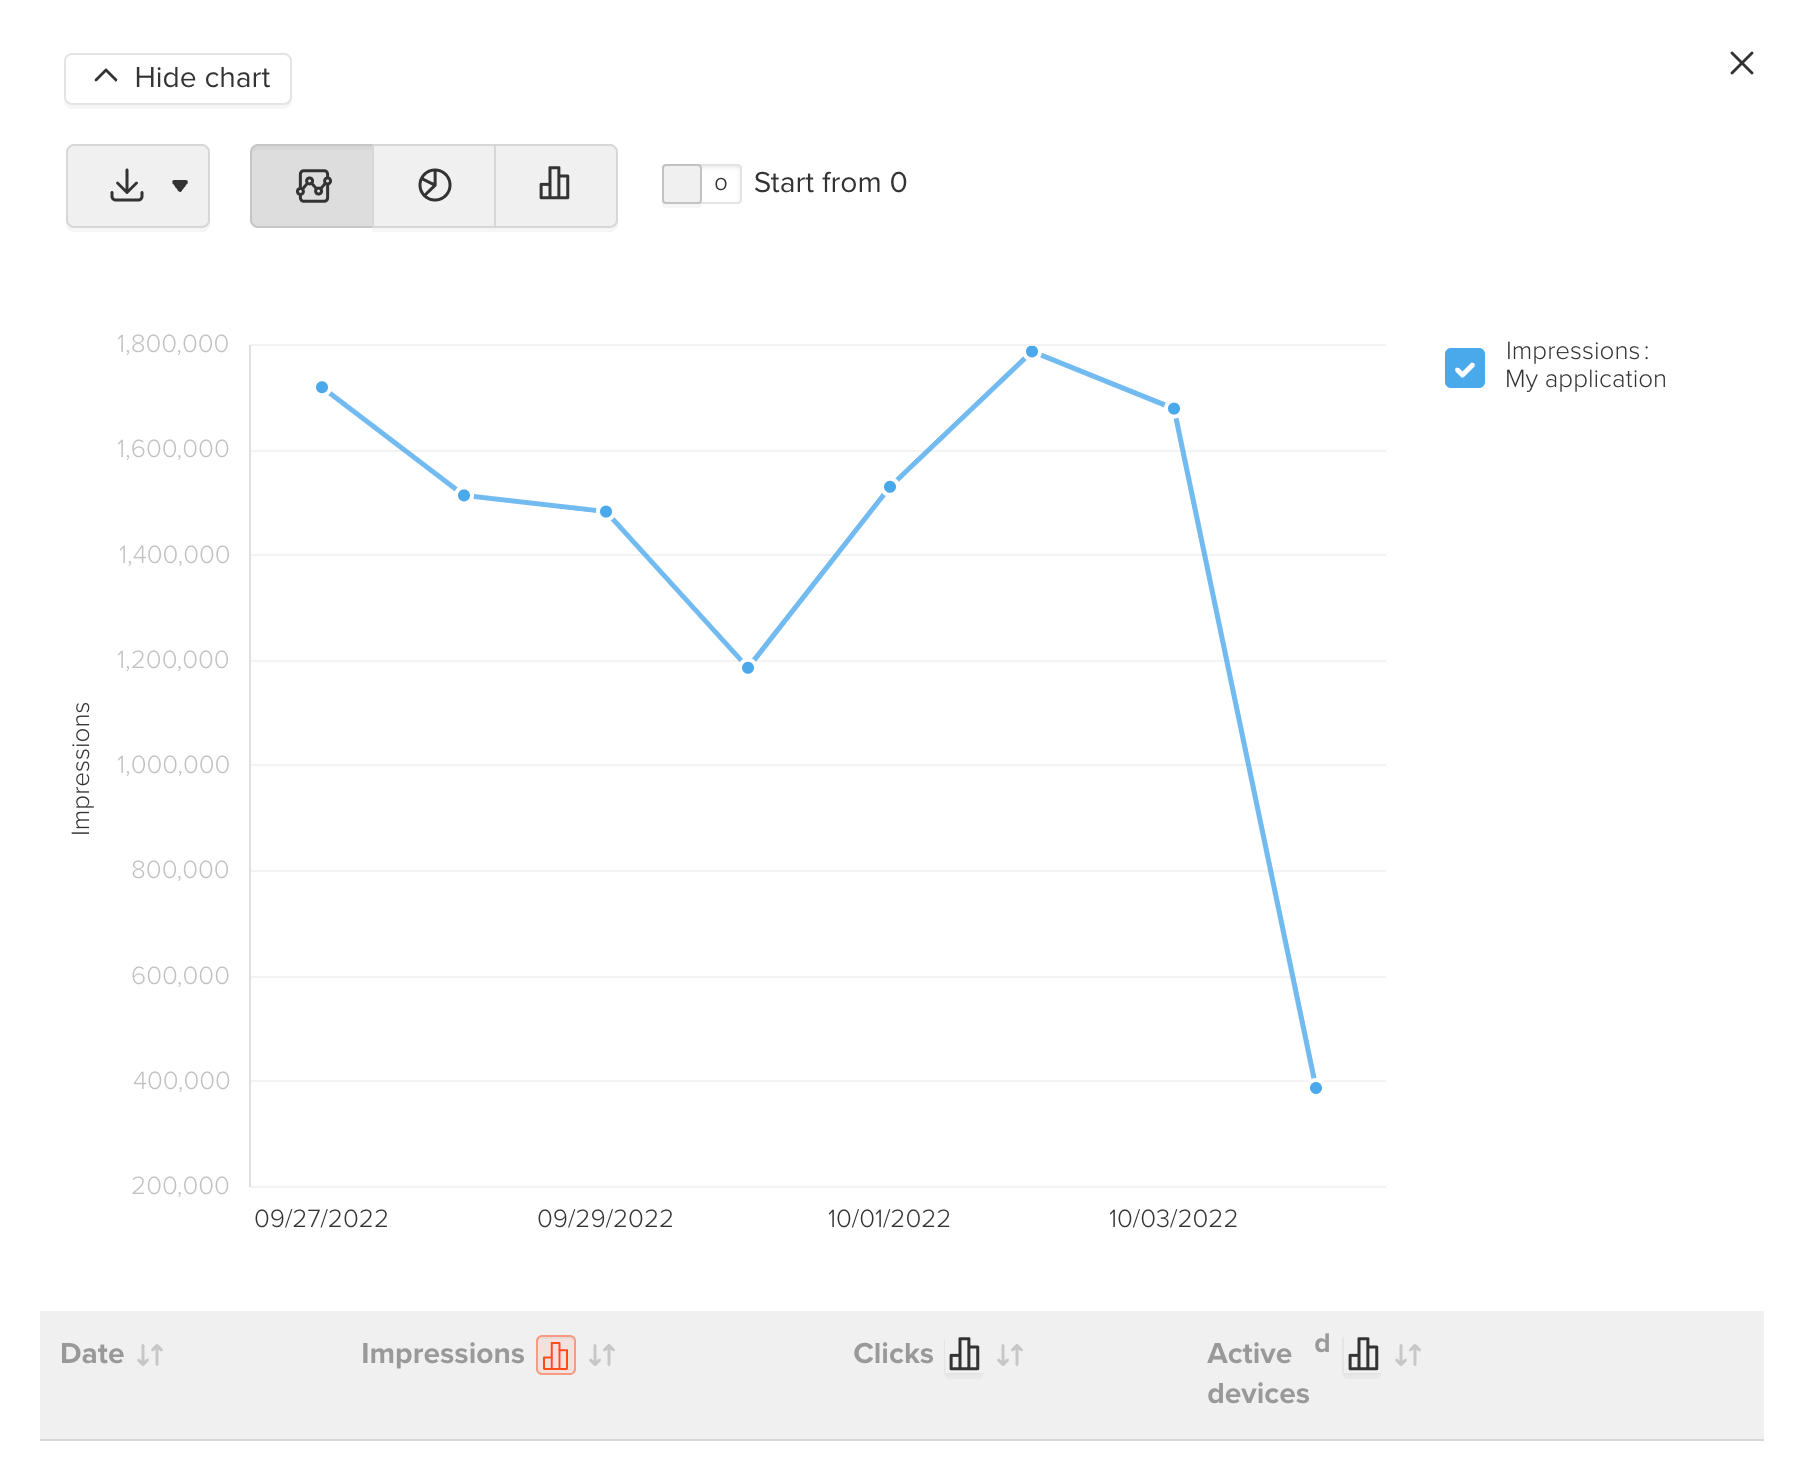
On charts with large values, you can enable the Start from 0 option, to plot the Y axis from zero and look at the graph on a different scale
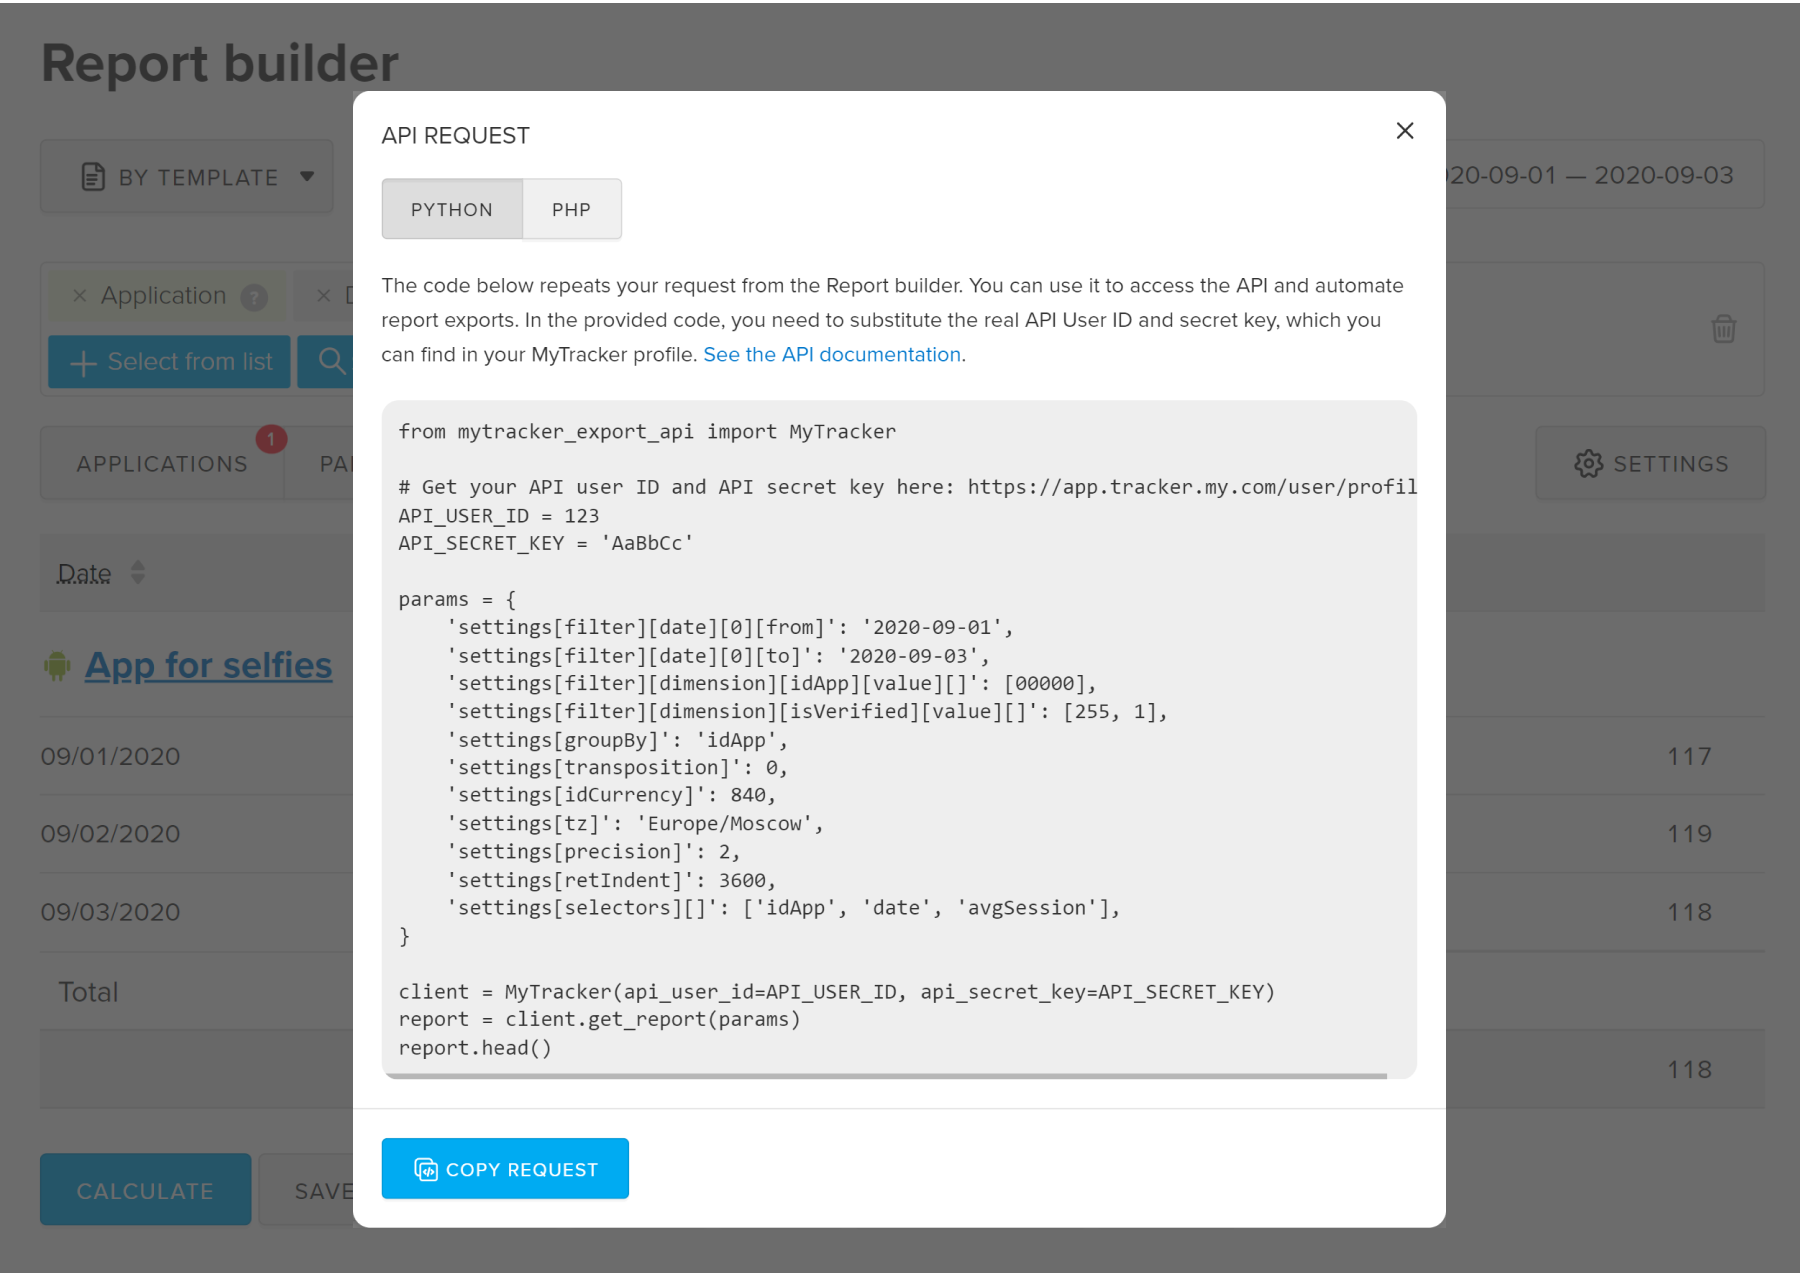
The API request is only available once the report has been created. Click Show API request on the report page to view the request code in Python and PHP.
You can copy the code to access the API and automate similar exports. In the provided code, you need to substitute the real API User ID and Secret key, which you can find in your MyTracker profile. For more details, see the Reports section.