After monitoring completed reports, you can proceed to detailed analysis in the Builder — start with combined metrics from MyTracker, and then gradually refine the data by adding more and more dimensions and fraud metrics.
It’s a universal approach suitable for those who do not have time for hard research, are not familiar with key fraud metrics, have just rolled out an ad campaign, or have entered into a new partnership.
We recommend building a report at least 3 days after an app install or the site visit when Fraud Scanner has collected enough data about fraudulent devices
Fraud metrics can be presented in absolute or percentage terms, where the percentage shows the number of fraudulent installs/site visits as a proportion of the total number of installs/visits made in the selected period.
For more details on analyzing data, refer to the How to read reports section
Use the Fraud Scanner filter to build a report, completely removing fraud from it or, to build a report only on fraud data.
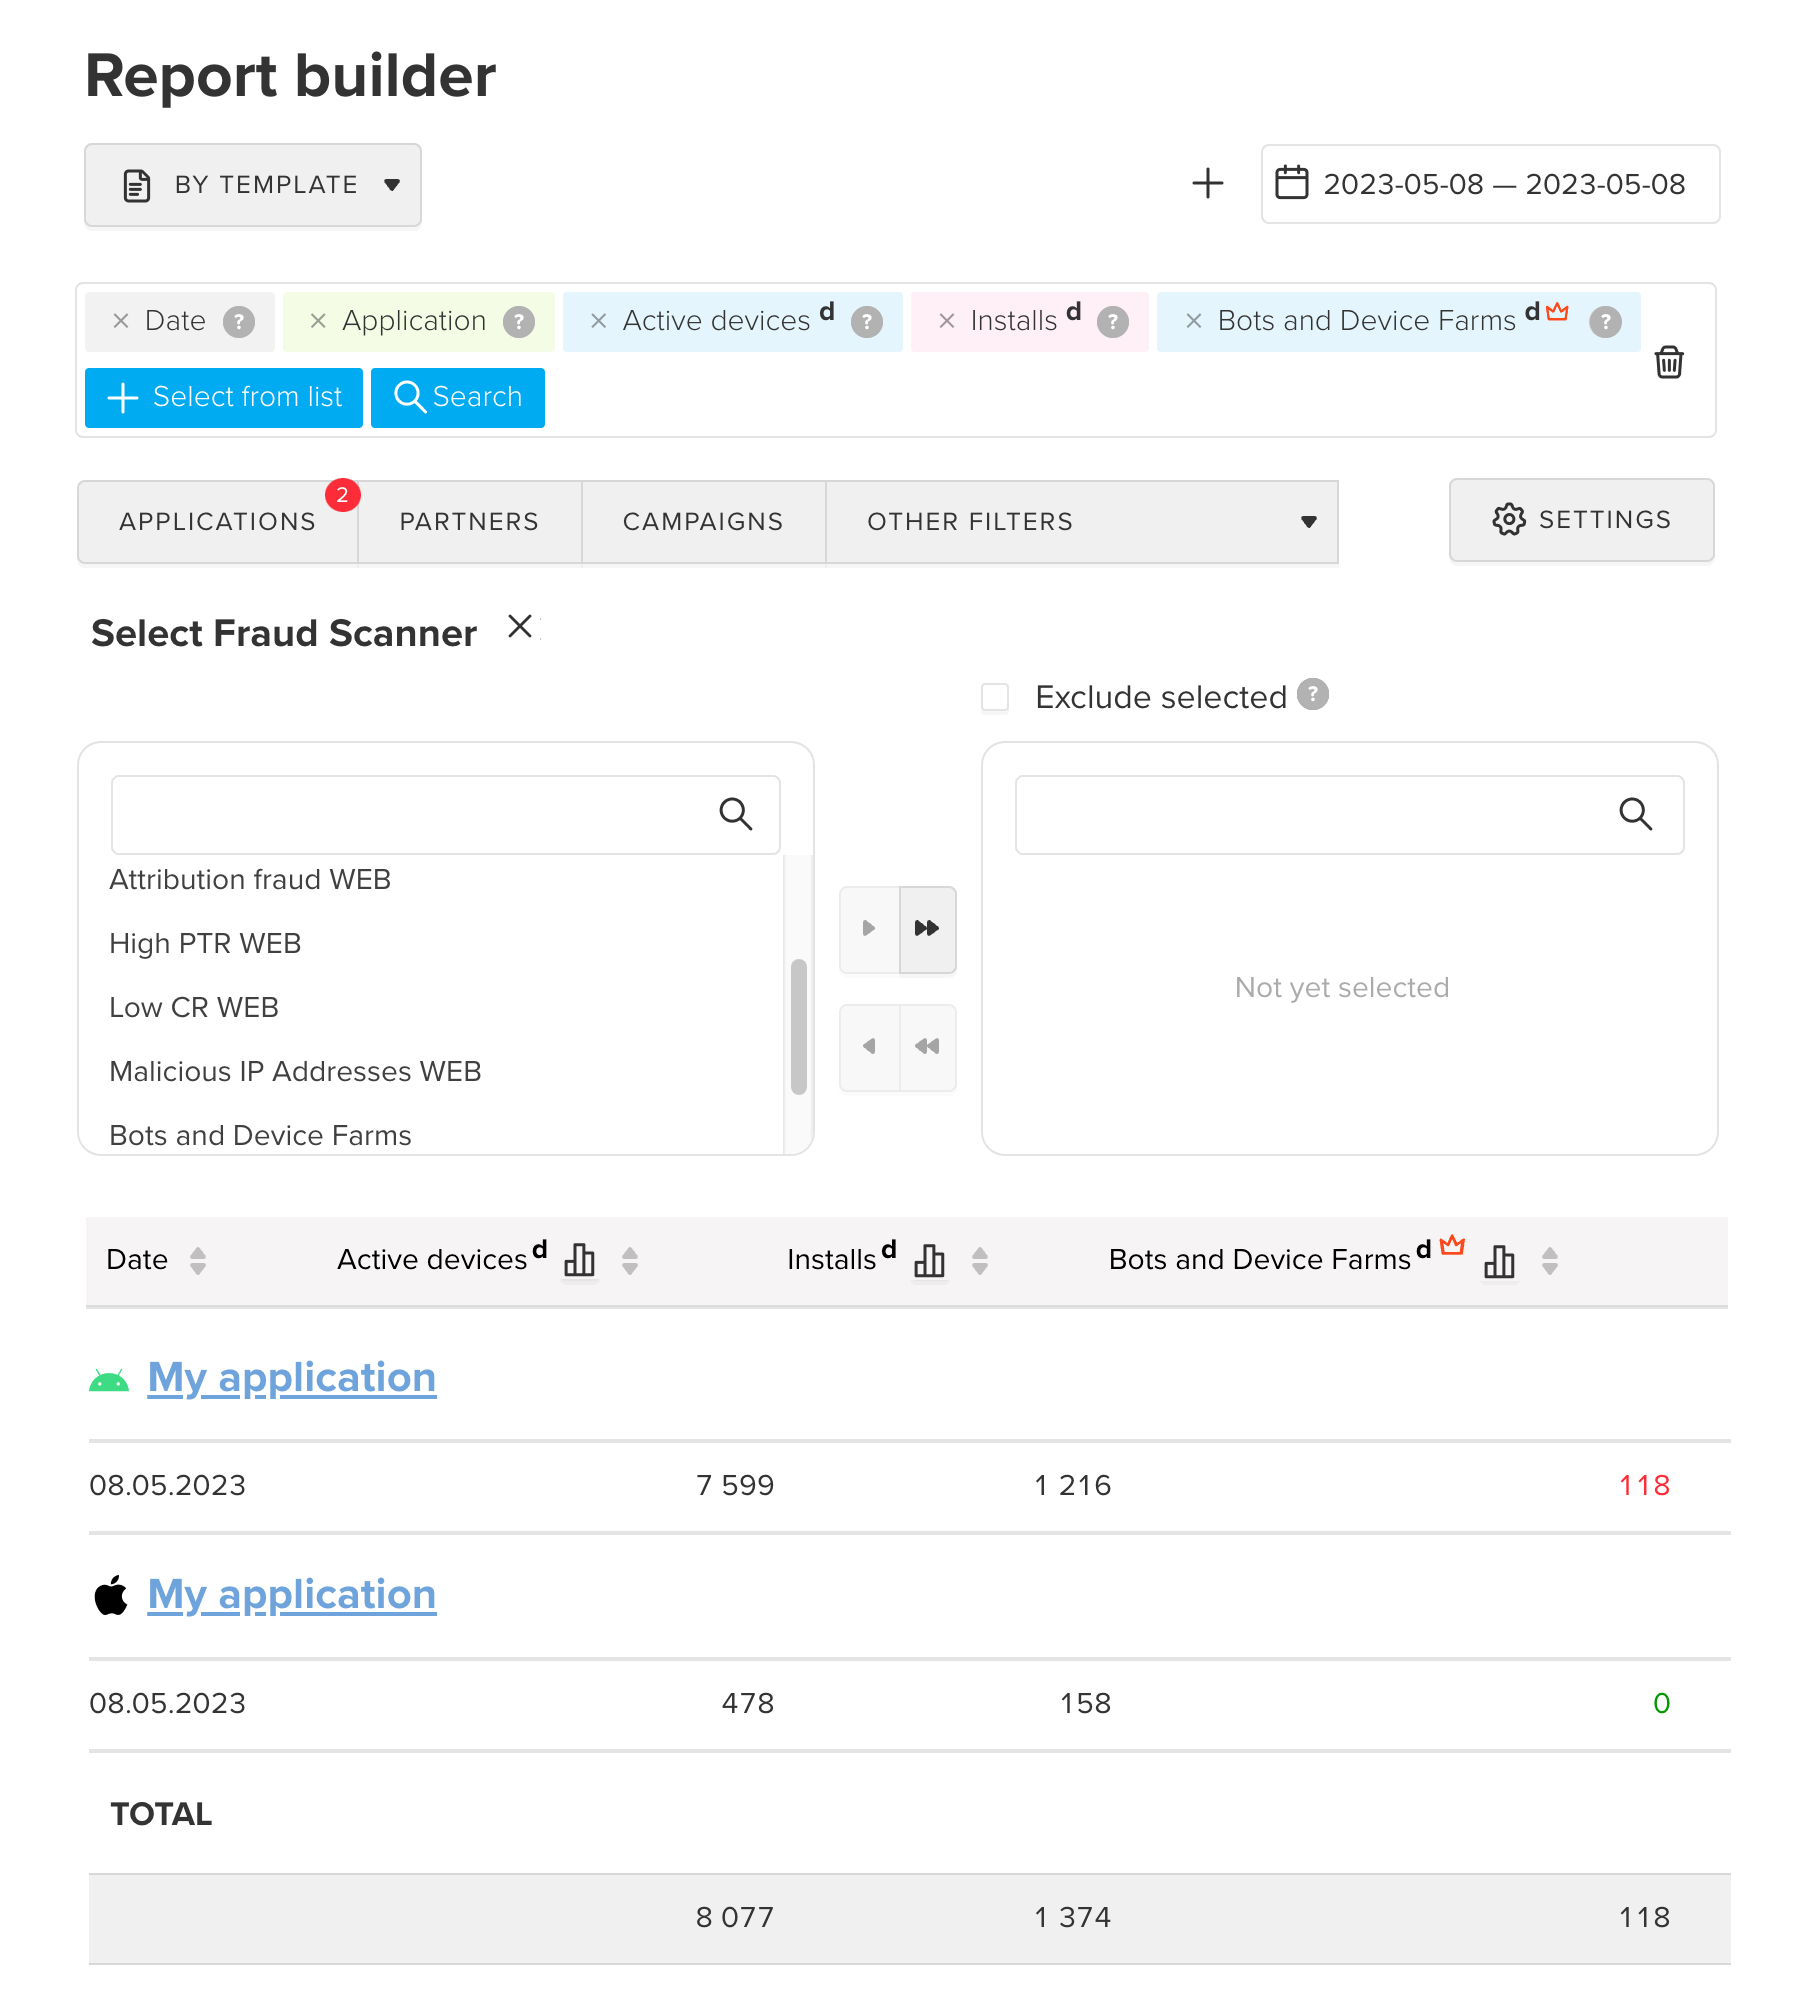
The picture below shows a report on Active devices, Installs, and Bots and device farms metrics without applying the Fraud Scanner filter. The report shows 8 077 active devices and 118 bots and device farms among 1 374 installs.
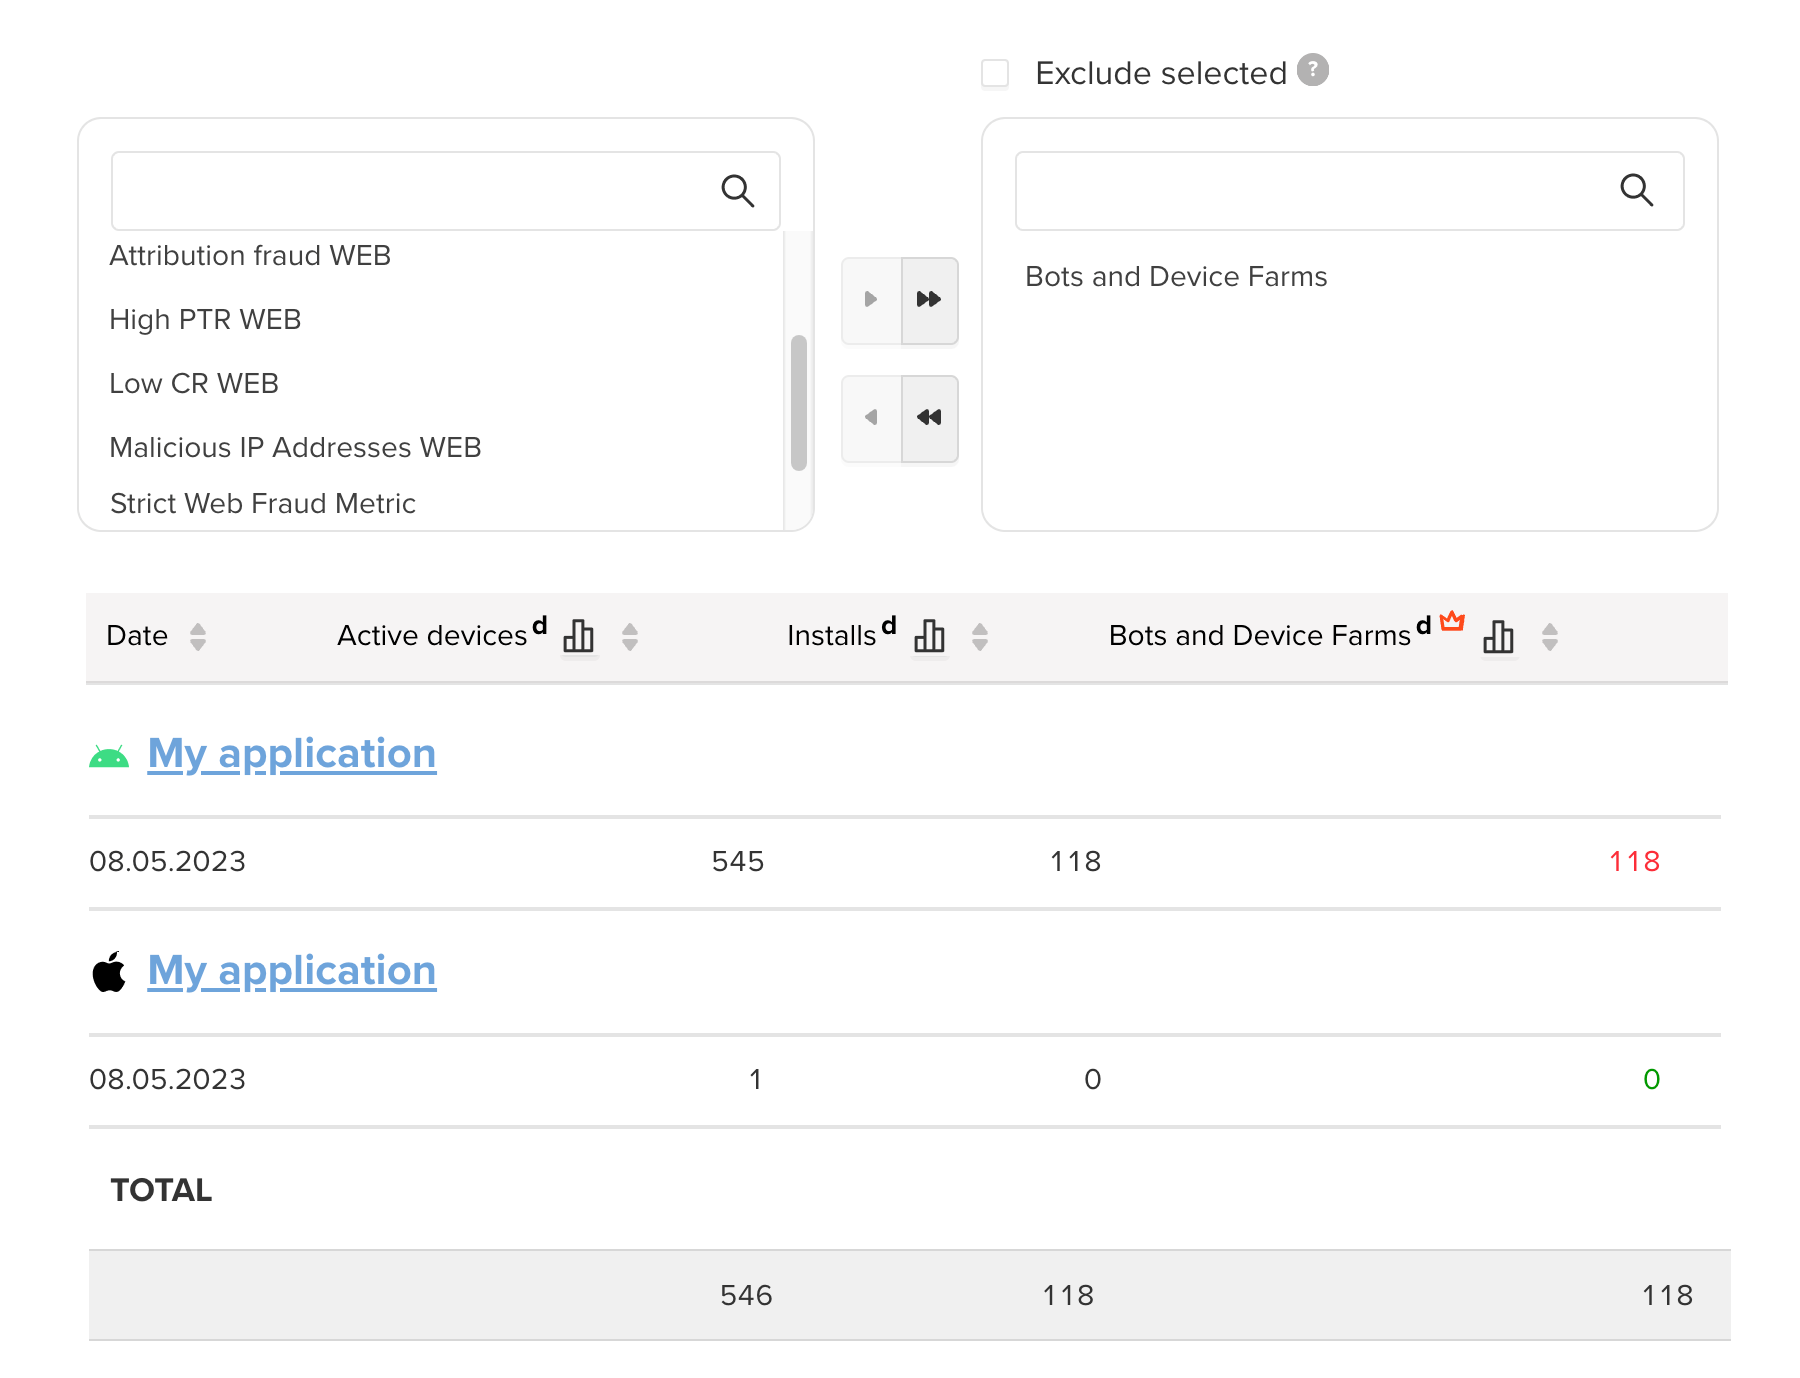
To build a report using the Fraud Scanner filter, in the Other filters → Fraud Scanner section, select fraud metrics and click Calculate. You will get the report with only data on fraud devices.
If a fraud filter is applied, then the number of installs in the report will be equal to the number of fraudulent devices, since Fraud Scanner metrics show the number of installs with fraud.
For example, in the picture below, the report is filtered by bots and device farms and shows 546 active devices, 118 installs and 118 bots and device farms. That is only fraudulent installs on the selected date.
To remove fraud data from the report, in the Other filters → Fraud Scanner section, select the metrics you want to exclude, then enable the Exclude selected option and click Calculate. You will get the report without any fraud data.
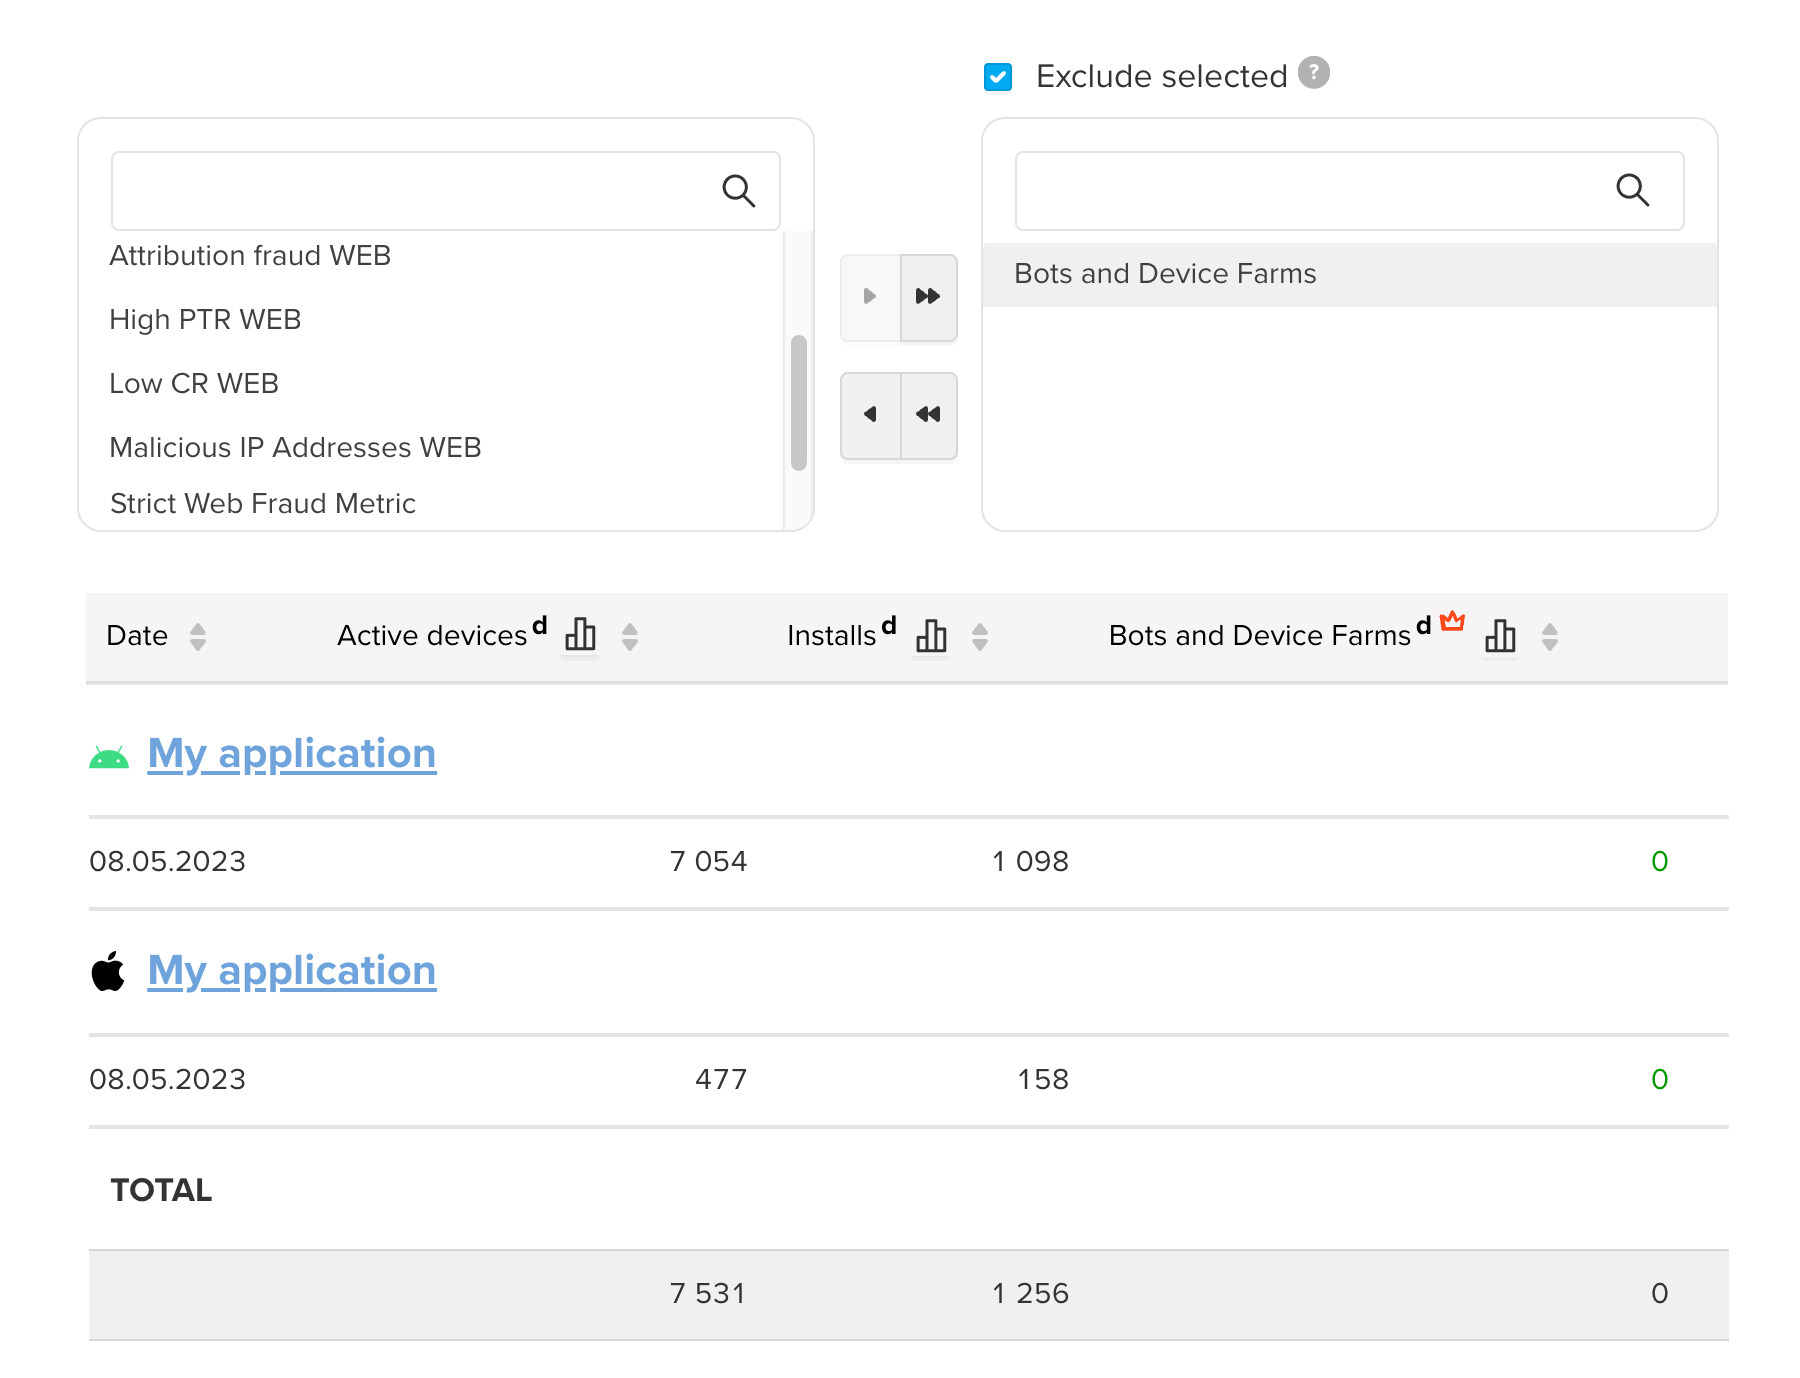
You can apply the Fraud Scanner filter to any other metrics.
Reports without fraud data might display a small number of fraud. This is due to the fact that the data on whether this device is fraudulent or not is received gradually.
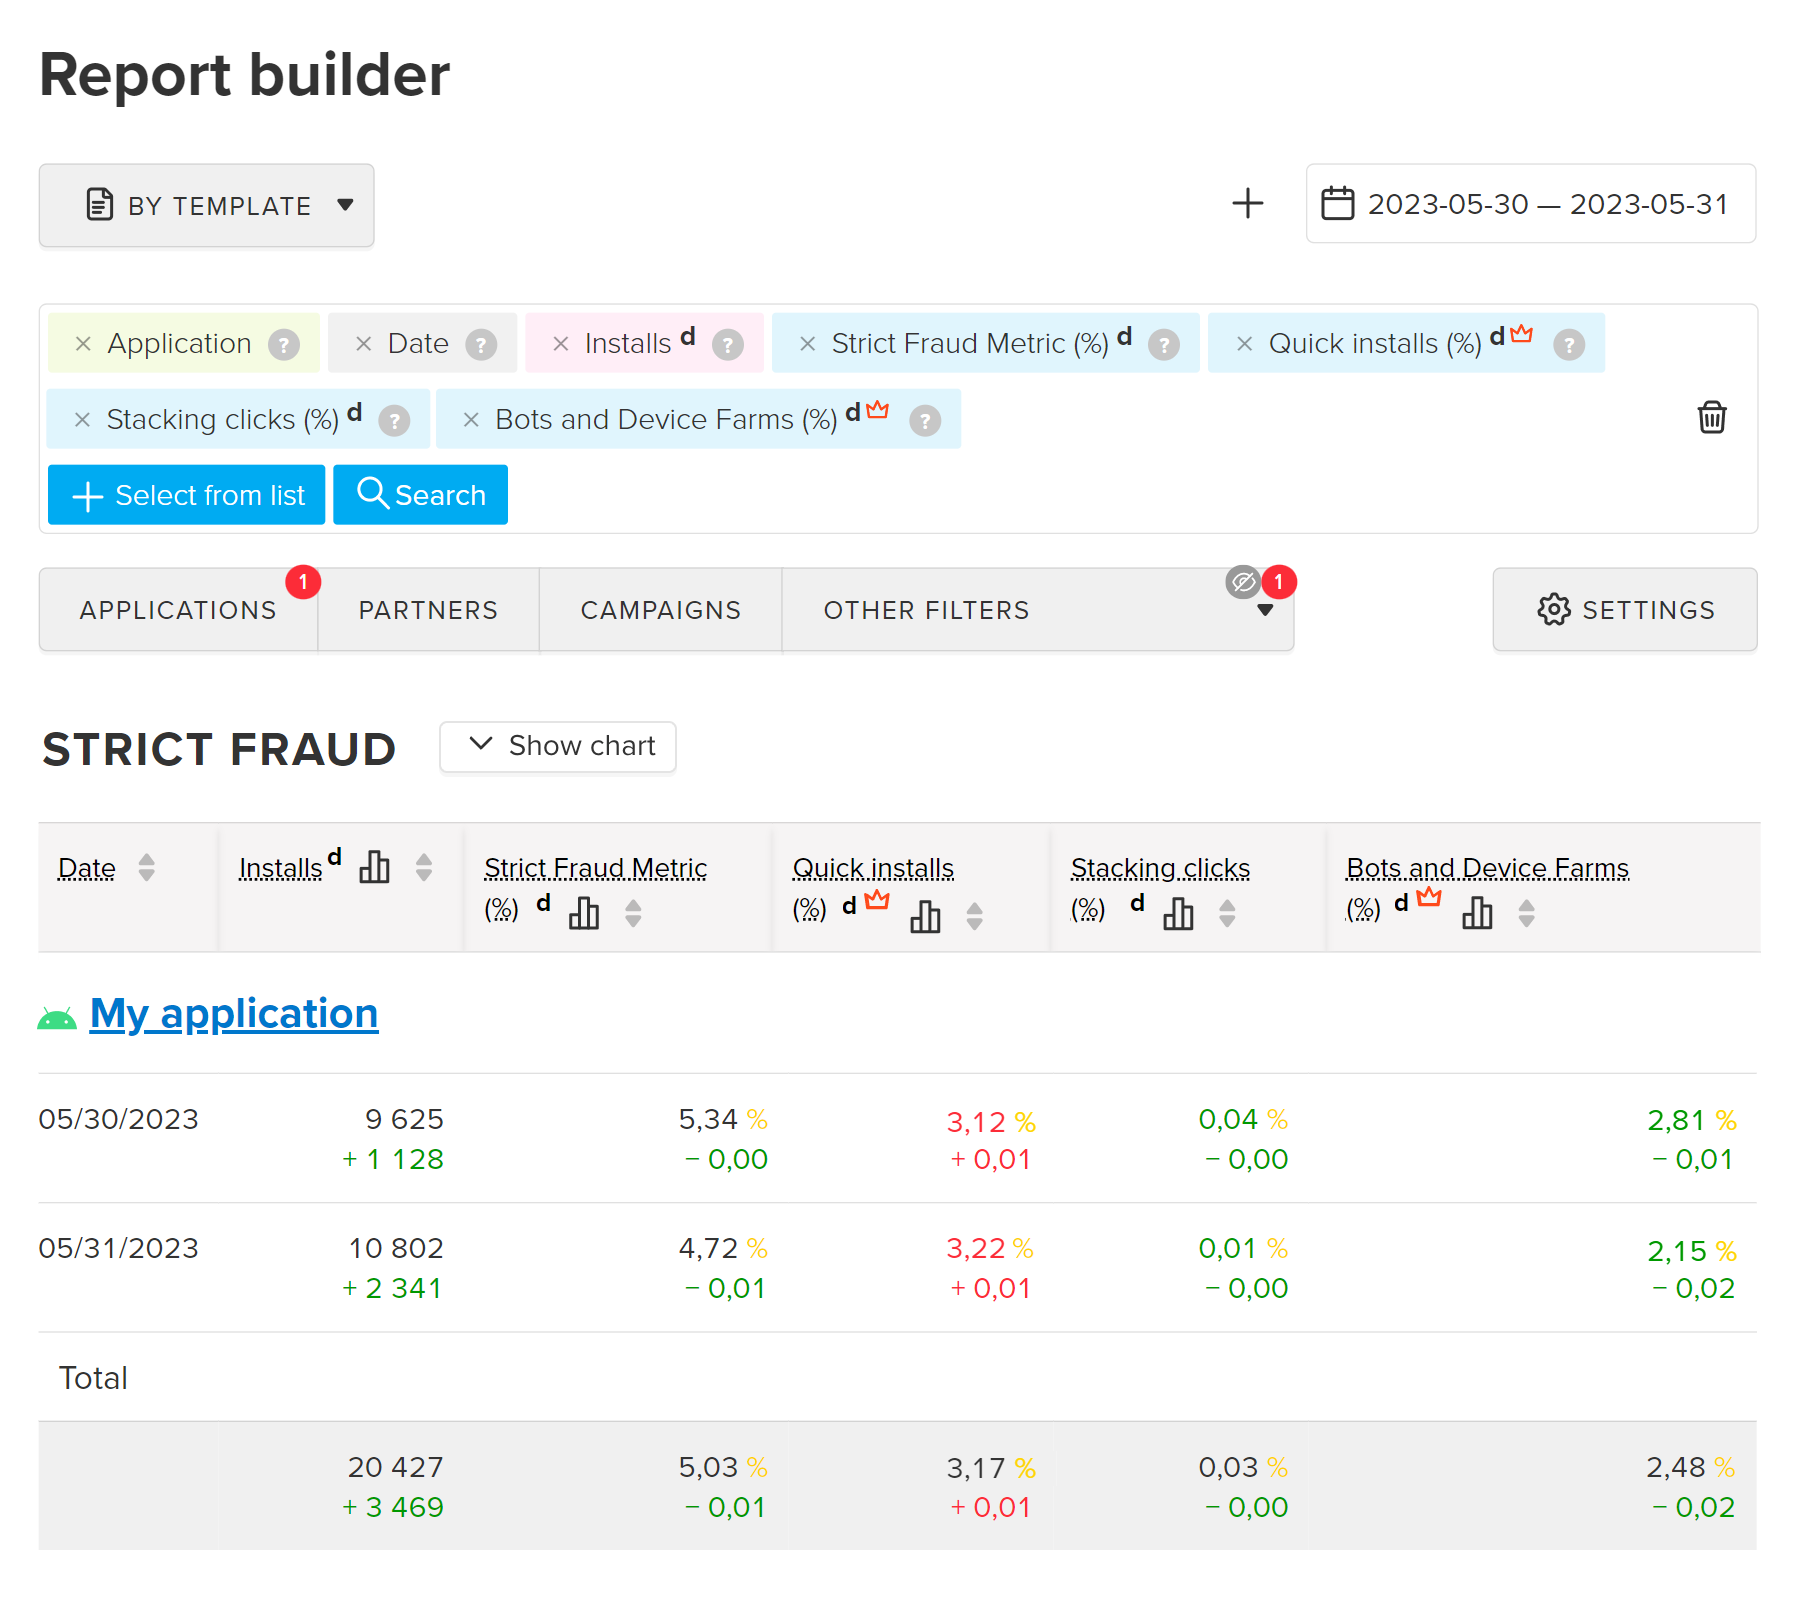
As an example, let's build a report using a Strict fraud template (Analytics → Templates). The report shows the number of suspicious and emulated devices, as well as the number of devices with quick installs and stacking clicks — i.e. the share of mobile traffic that is likely to be fraudulent.
The report includes data for installs made only during the selected report period. Remember, the most accurate fraud indicators are only available 3 days after an install, when Fraud Scanner has collected enough data about the user behavior.
Below you’ll find info on how to read reports using benchmarks, installs, comparison, and dimensions.
Color indicators in the report are related to benchmarks.
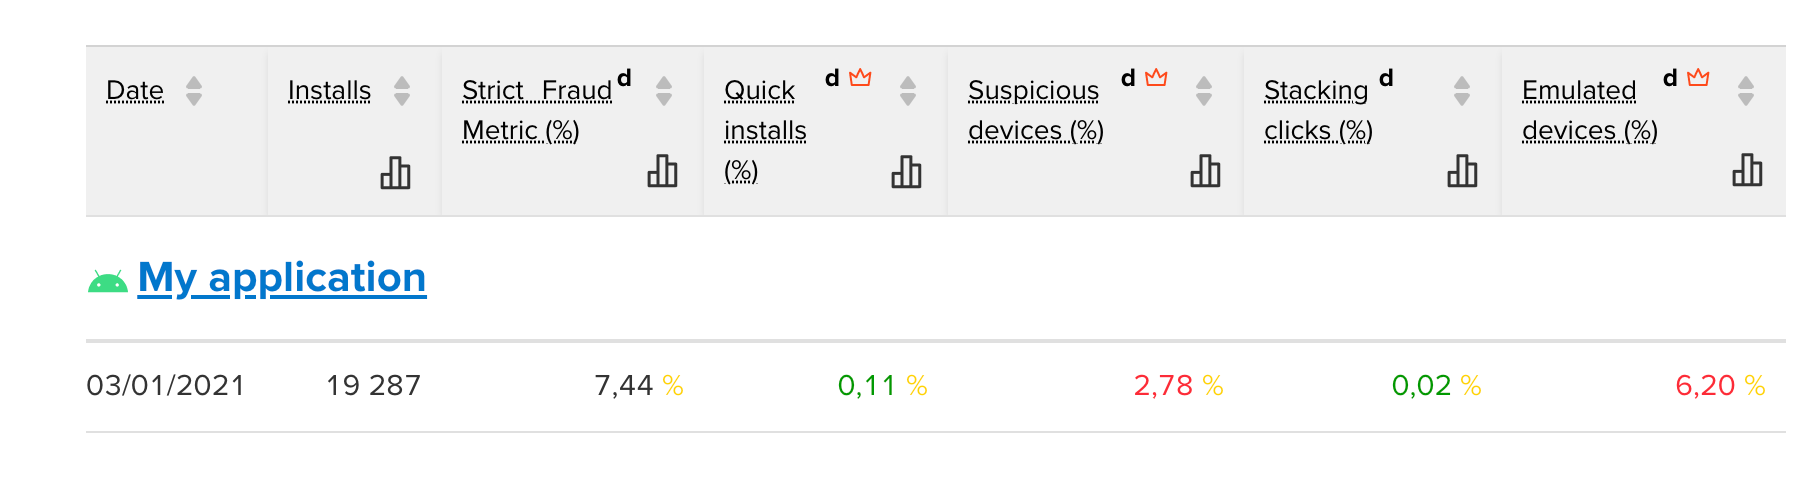
If the values are highlighted in red (above the benchmark), we recommend adding more dimensions: Select from list → Dimensions → Traffic source → Campaign or Partner to determine the potential source of fraudulent traffic and take necessary measures.
Color-based fraud indication is only applicable if there is an Application or a Platform dimension in the report
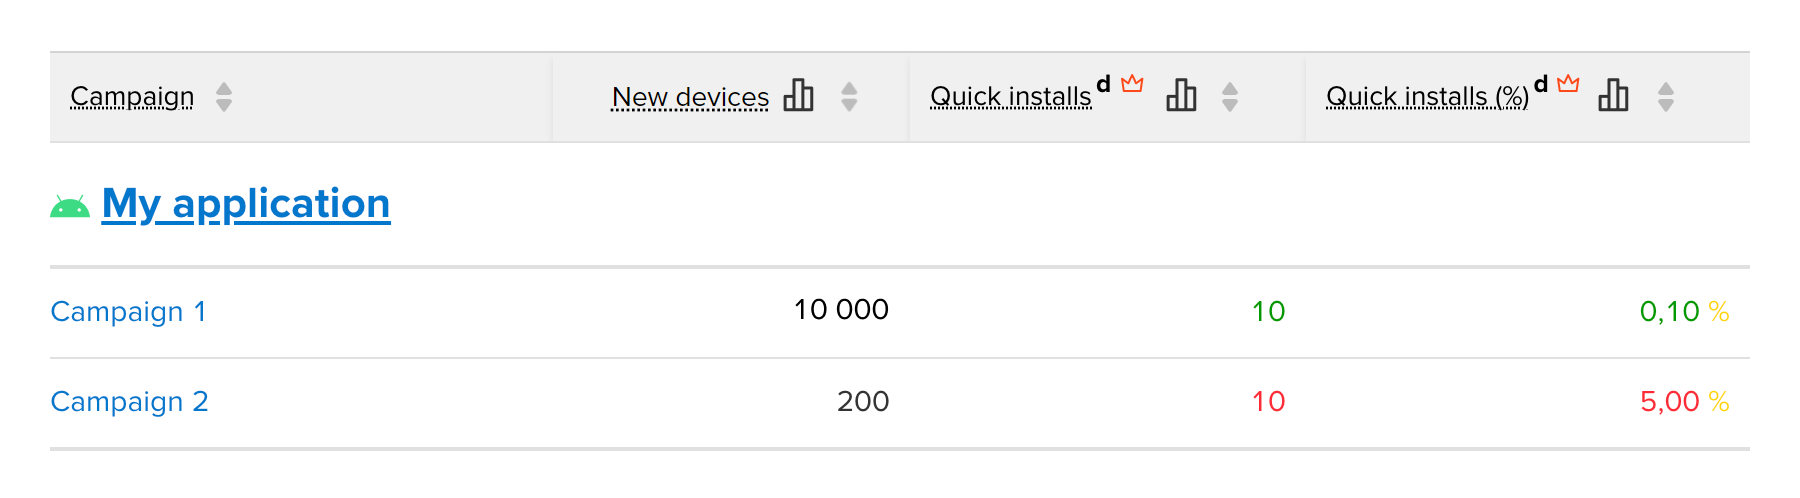
Use the New devices metric to see the volume of incoming traffic. This comes in handy when working with absolute metrics (not percentage ones), when the same fraud values can be highlighted with different colors. Fraud indicators per se do not mean a fraud attack, it's the share of fraud in the total number of new installs that’s important.
Compare the following:
It's clear that campaign 2 is using fraud methods to drive traffic.
Compare fraud metrics with data from previous periods, such as yesterday or the previous month, to track suspicious traffic flow.
The results of the comparison feature the "+" and "-" signs. Color coding is the same:
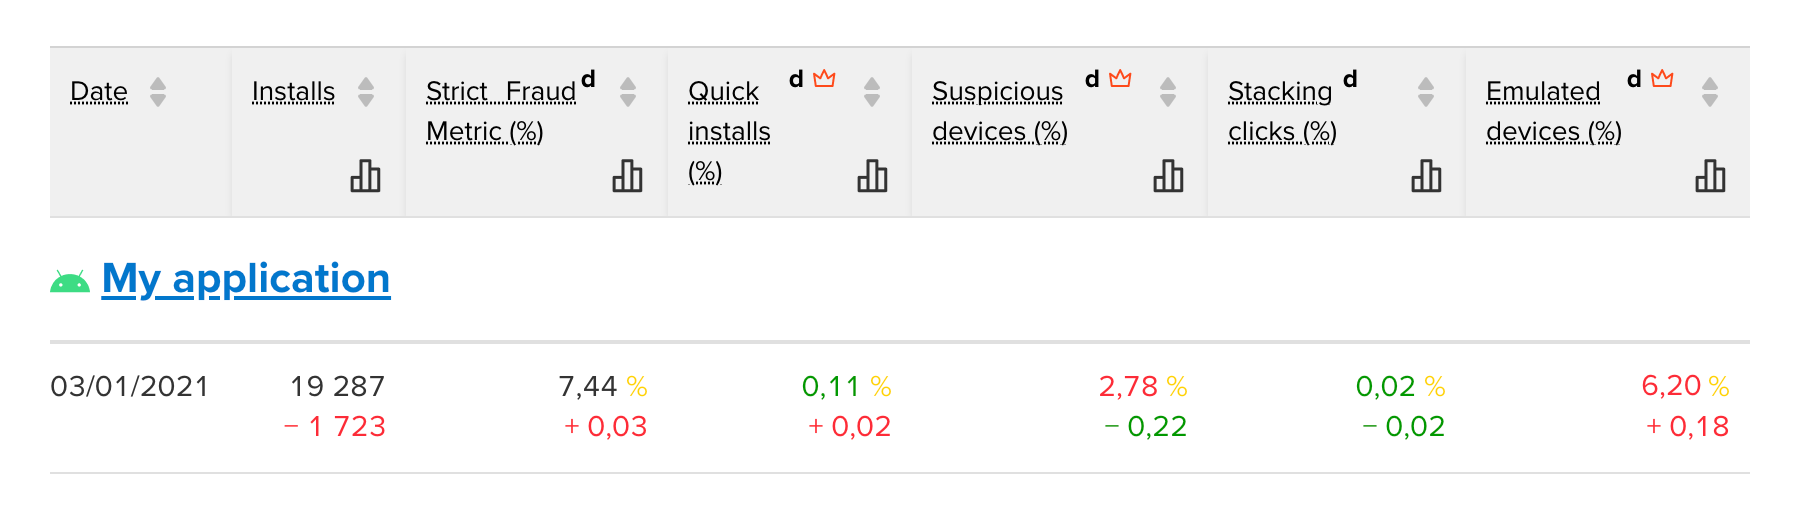
Template reports are configured to compare data with those of the previous day. To add a comparison chart to your report, click Settings in the Builder, and enter new settings in the Comparison field.